We use the PMP Fast Track to answer PMP questions quickly and easily. Check it out!
Question 61 – Risk of Missing Deadline
The project is behind schedule and over budget, with no extra funds available. What should be done to avoid missing the deadline?
Question 62 – How to Estimate?
During the planning phase, stakeholders require highly accurate cost and schedule estimates. Which estimation method should be used?
Question 63 – Finding the Root Cause
The team is experiencing recurring delays, and members disagree on the cause. What technique should be used to determine the root issue?
Question 64 – Delays in Lessons Learned
During the closing phase, delays were experienced, but the root cause is unknown. How can the team ensure these issues are prevented in future projects?
Question 65 – Resolving Conflict Between Team Members
Two team members have conflicting opinions on how to complete a critical task, one preferring a traditional approach and the other an innovative one. How should the conflict be managed?
Question 66 – Communication Channels
You need to determine the number of communication channels for an eight-member team using the formula: n(n-1)/2.
Question 67 – Not Receiving the Right Information
Stakeholders are frustrated due to communication gaps. You must decide the best approach to improve communication effectiveness.
Question 68 – Brainstorming Risks
Your team is developing a risk register and needs to assess internal and external factors that could influence the project’s success.
Question 69 – How Risks Affect Project Timeline
You need to analyze how uncertainties impact the project’s schedule and costs by visualizing possible outcomes and their likelihood.
Question 70 – Enough Resources to Address Risk
Weather delays may threaten the budget and timeline, and you must determine whether contingency reserves are sufficient to address the risks.
Pep Talk
What is a wonderful thing is that you’ve gotten through these 10 questions. You’ve done such an amazing job, and studying and practicing is how you get to your goals and how you improve yourself and get a skill set that is extremely valuable in the marketplace. Project managers are needed everywhere to deliver change and to deliver value that’s necessary for companies to grow. You are doing the right thing. I believe in you. Keep
going!
We use the PMP Fast Track to answer PMP and CAPM questions quickly and easily. Check it out!
Question 51 – System Interactions
Stakeholders request a visual representation of how a new system will interact with existing systems. What tool should you use?
Question 52 – Project Charter Contents
The sponsor wants to reduce rework by using information from the project charter. What key details will not be found there?
Question 53 – Next Step After WBS
Your team has created a Work Breakdown Structure (WBS) and defined work packages. What should you do next in the planning process?
Question 54 – Scope Baseline Completion
The scope baseline is nearly complete with the scope statement and WBS finalized. What is the next step?
Question 55 – Managing Scope Creep
The project is receiving many small change requests, raising concerns about scope creep. How should you handle this situation?
Question 56 – How to Logically Schedule Activities
How should project activities be scheduled logically? Consider dependencies like finish-to-start relationships and methods such as the Precedence Diagramming Method (PDM).
Question 57 – Ensure it meets industry standards
How can you ensure your product outperforms competitors and meets industry standards? Options include benchmarking, root cause analysis, and risk assessment.
Question 58 – Ready to Close – What NOT to do?
What action is NOT required when closing a project? Tasks include documenting lessons learned, preparing final reports, and releasing personnel, but some activities belong to earlier phases.
Question 59 – Whether to use a Vendor or not
A critical system functionality is needed, but there are budget and timeline constraints. What’s the best approach—hiring internally, root cause analysis, scope reduction, or a make-or-buy analysis?
Question 60 – Lots of conflicting stakeholders
During project initiation, numerous stakeholders have conflicting priorities. How should you manage and prioritize them? Options include stakeholder mapping, selective engagement, workshops, or escalation.
Pep Talk
A wonderful tool for your study is to practice every single day, in the way that you have been doing. So I think you’re doing a fantastic job! Keep going, keep learning, keep growing, and all of these things we can take and use on our real world projects straight away. Some of these are extremely handy tools to have in our back pocket as project managers. You’ll be able to take these tools and use them any time you need by learning these things, learning the right things and doing great things as a project manager. Keep going, I believe in you!
A senior stakeholder dominates a critical project decision, making team members hesitant to voice opinions. How should the project manager ensure all voices are heard?
Question 47 – Team Can’t Understand System Design
The project team struggles to understand the proposed system design and features. What should be done to improve comprehension and alignment?
Question 48 – Major Industry Change Affecting Prioritization
A major change in the industry leads to disputes over which product features should be prioritized for release. How should prioritization be determined?
Question 49 – Scheduling Issues in Construction Project
Inefficiencies in task scheduling have led to delays, particularly with materials arriving too early or too late. How should the scheduling issues be resolved?
Question 50 –Resource Constraints and Overallocated Team Member
A team member is assigned to multiple tasks at the same time, potentially causing project delays. What resource management technique should be applied?
Pep Talk
What is fantastic is your ability to study this every single day to grow to improve, to get better and not only get better but get better at something which is so important, and that is delivering value and managing projects and doing these wonderful things that will help people in the real world by delivering this value. It’s so valuable! Keep going, I think you’re doing a fantastic job.
Question 31 – Material Change in Construction Project
A supplier offers a cheaper, suitable material midway through the project. How should you handle this opportunity while ensuring proper approval?
Question 32 – New Logistics Partner Integration
A client adopts a new logistics partner requiring major system changes. What steps should you take to manage this impact effectively?
Question 33 – Stakeholder Unhappy with Approved Change
A key stakeholder is dissatisfied with a change that has already been approved and implemented. How do you address their concerns?
Question 34 – Resource Inefficiencies in High-Priority Project
Some team members are overloaded while others are underutilized, leading to inefficiencies. What’s the best way to optimize resources?
Question 35 – Pressure to Begin Work Without a Plan
A new initiative is suggested but lacks formal analysis, and stakeholders are pressuring you to start. What is the first step to properly initiate the project?
Question 36 – Benefits Management Plan
What does a benefits management plan include, and what is its primary purpose?
Question 37 – Organizational Structure
In which type of organizational structure does the project manager have significant authority over project resources, including budget and scheduling decisions?
Question 38 – Project Approach
What is the best project management approach for an initiative with a fixed timeline, well-defined requirements, and minimal scope changes?
Question 39 – Gathering Expert Insights
What is the most efficient way to quickly gather insights from multiple subject matter experts (SMEs) on key project features?
Question 40 – Leadership and Team Morale
What is the best leadership approach to rebuild team morale and encourage open communication after taking over a project from a manager who lacked transparency and support?
Pep Talk
You’ve done an amazing job! Studying towards your PMP or your CAPM is the most worthy thing you can do this year you’re doing an amazing thing and just by studying every single day I know you’ll have success towards your goal. You’re doing the right thing – by studying, by improving, learning and growing. Keep going!
What is Business Analysis and What Does a Business Analyst Do?
In the world of project management, you may have heard of a business analyst (BA). Whether you’re preparing for a certification exam like the Certified Associate in Project Management (CAPM) or working with a business analyst, it’s important to understand what they do. In this article, we will explain what business analysis is, what a business analyst’s role involves, and how they help make projects successful.
Who is a Business Analyst?
Here is a simple way to explain a business analyst’s role. There are three main tasks that define business analysis:
Gathering Requirements: A business analyst works with stakeholders and customers to collect their needs.
Ensuring the Solution Matches: Once the requirements are gathered, the BA ensures that the solution meets these needs.
Evaluating the Outcome: After the solution is delivered, the BA checks if the desired results—like increased revenue or better customer satisfaction—were achieved.
This basic explanation gives a clear idea of the BA’s job in a project.
The Role of a Business Analyst in a Project
In a typical project, there are several stages: initiation, planning, execution, monitoring and controlling, and closing. A business analyst focuses on three key areas throughout the project:
Stakeholder Management: The BA identifies and works with stakeholders to gather and refine project requirements.
Scope Definition: The BA helps define the project’s scope, ensuring the right requirements are included.
Quality Assurance: The BA ensures that the solution matches the defined requirements and meets quality standards.
These three areas—stakeholders, scope, and quality—are vital for a business analyst’s success and contribute to the overall project success.
How Business Analysis Works in Practice
1. Engaging Stakeholders and Gathering Requirements
The business analyst’s first task is to identify and engage the right stakeholders—customers, users, and anyone affected by the project. To do this, the BA uses tools like an organizational breakdown chart to identify key people within the organization. Once the right stakeholders are identified, their roles are documented in a stakeholder register.
The BA uses a stakeholder classification matrix to assess the influence and impact of each stakeholder, focusing on those who have the greatest influence on the project’s outcome. Engaging the right people early ensures that the gathered requirements are accurate.
2. Eliciting and Visualizing Requirements
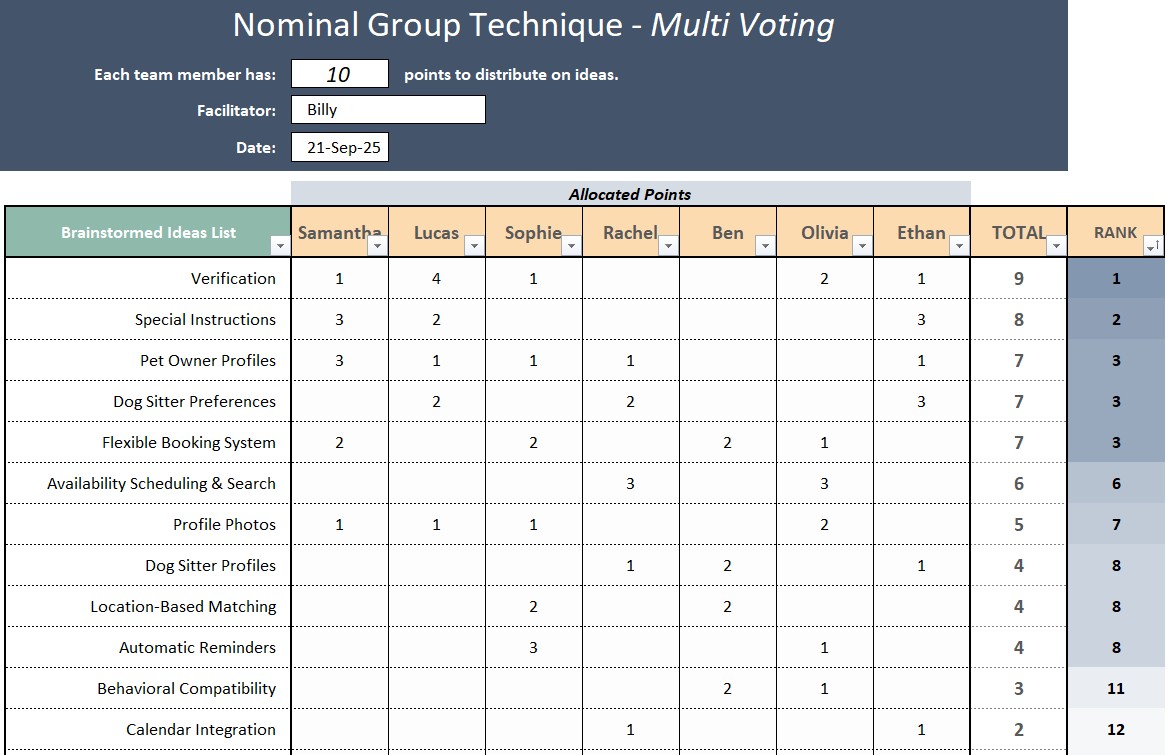
Once stakeholders are engaged, the BA uses various techniques like workshops, brainstorming, and facilitation skills to gather requirements. One effective method is the Nominal Group Technique, where everyone writes down their ideas anonymously, avoiding bias from higher-ups in the room.
After gathering the requirements, the BA visualizes them to ensure they are clear and understandable. Techniques such as process mapping, SE diagrams, and context diagrams help the BA create visual representations of how the system works or will work in the future. These diagrams make it easier for everyone to understand the requirements.
3. Ensuring the Solution Matches Requirements
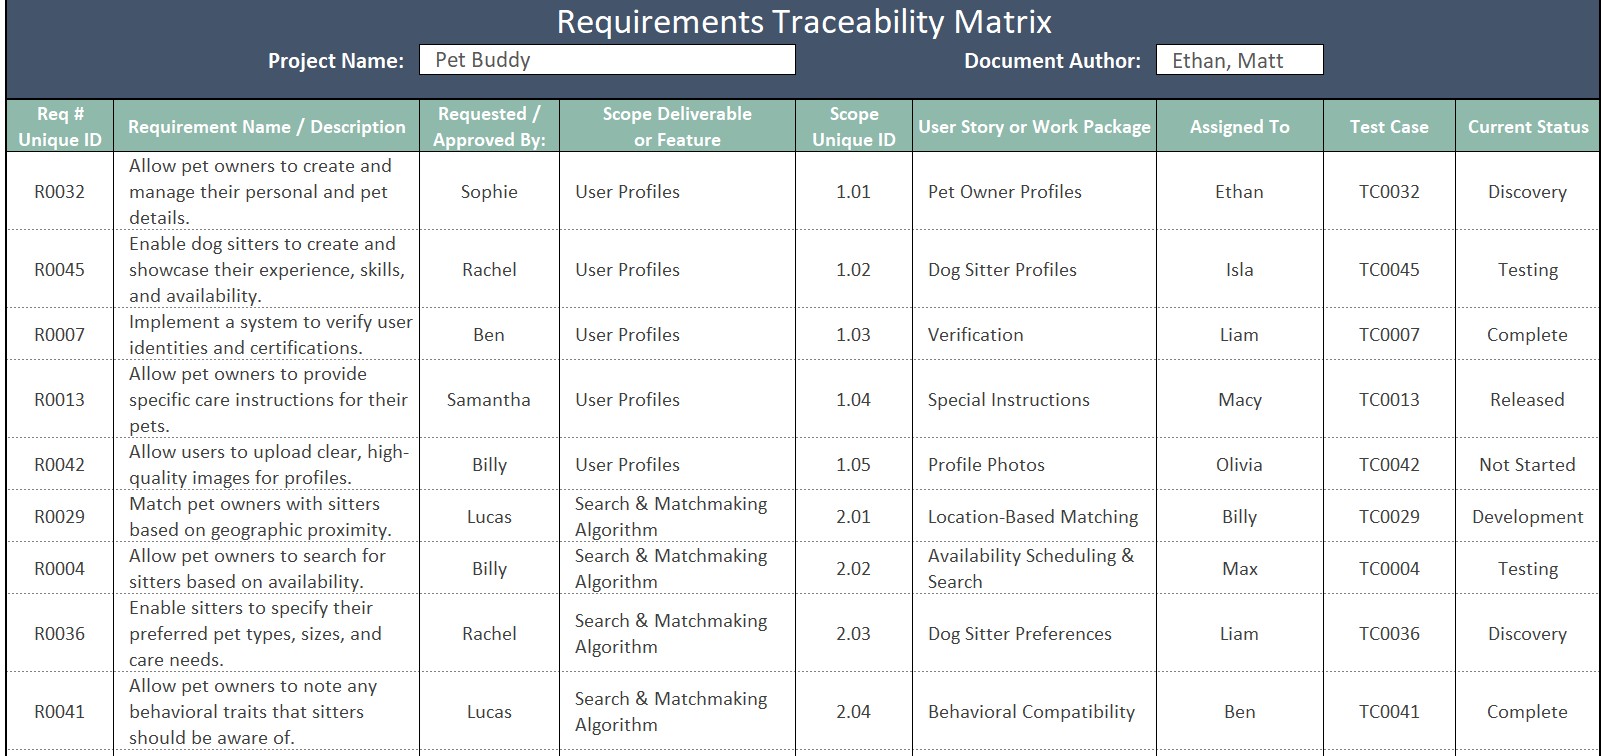
After gathering and visualizing requirements, the BA works with developers and the project team to make sure the solution aligns with the requirements. To do this, the BA uses a Requirements Traceability Matrix, which ensures that all requirements are covered and tested.
The BA also helps break down the project into smaller tasks using a work breakdown structure (WBS). This helps the team manage the work more easily. The BA ensures that acceptance criteria are clearly defined, so the project team knows what is required for each task to be considered complete.
4. Evaluating the Success of the Solution
Once the solution is delivered, the BA checks if it achieved the desired results. Did it improve customer satisfaction? Did it increase revenue or reduce costs? The BA may use tools like Net Promoter Score (NPS) or customer satisfaction surveys to measure the impact.
Additionally, the BA may conduct a retrospective meeting with the project team to review what went well and what could be improved for future projects.
Tools and Techniques a Business Analyst Uses
Business analysts rely on various tools to do their job effectively. Here are some of the most common ones:
Stakeholder Register and Stakeholder Classification Matrix: To identify and assess stakeholders.
Workshops, Brainstorming, and Nominal Group Technique: To gather requirements.
Process Mapping, Sequence Diagrams, and Context Diagrams: To visualize systems and processes.
Requirements Traceability Matrix: To ensure requirements are met.
Work Breakdown Structure (WBS): To break down tasks into manageable pieces.
Acceptance Criteria: To define when a task is complete.
These tools help the business analyst manage requirements, scope, and quality throughout the project.
The Key Skill of a Business Analyst: Drawing Out Answers
A business analyst’s key skill is the ability to draw out answers. The BA doesn’t need all the answers at the start of the project. Instead, they must be good at asking the right questions and engaging the right people to uncover the information needed. This skill is essential for steering a project in the right direction.
Conclusion
A business analyst plays an important role in project management. They gather and clarify requirements, make sure the solution matches those needs, and evaluate the results to ensure success. By focusing on stakeholders, scope, and quality, business analysts help guide projects to successful outcomes.
With the right tools and techniques, a business analyst can keep the project on track and make sure it delivers value. Whether you’re preparing for a certification exam or working with a business analyst, understanding their role will help you achieve better project outcomes.
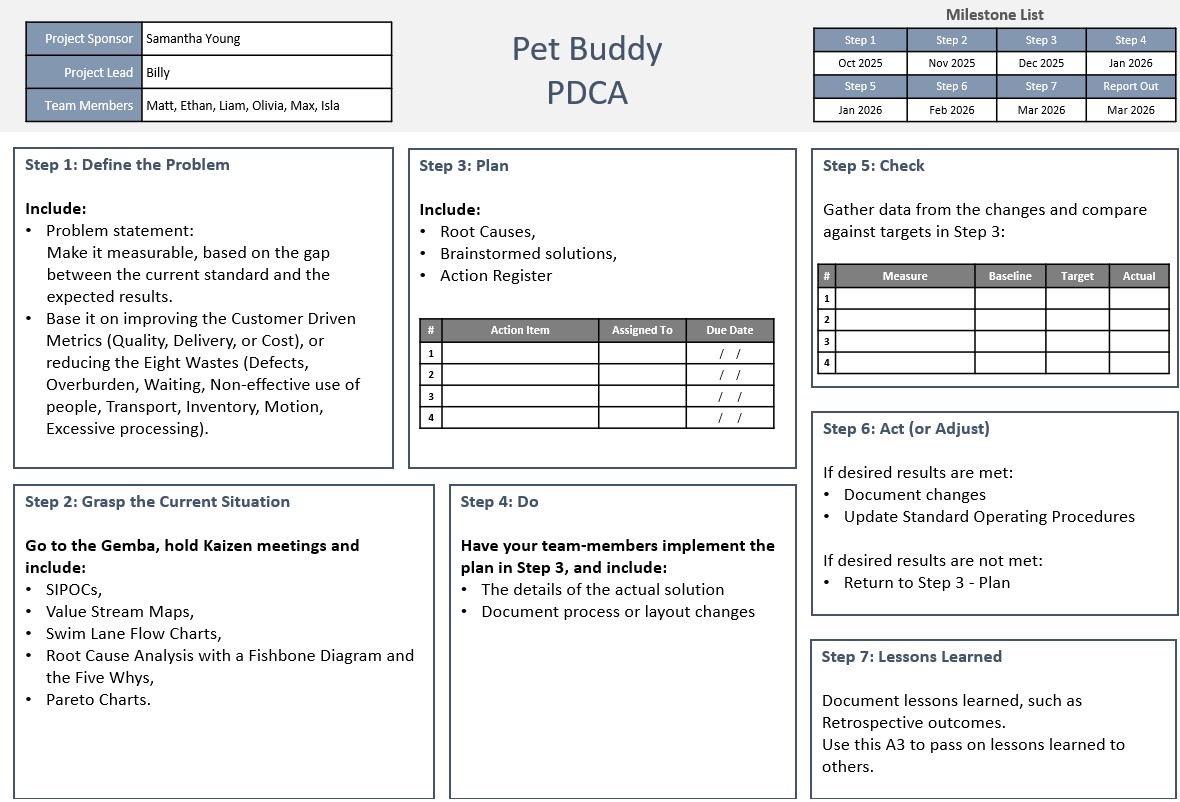
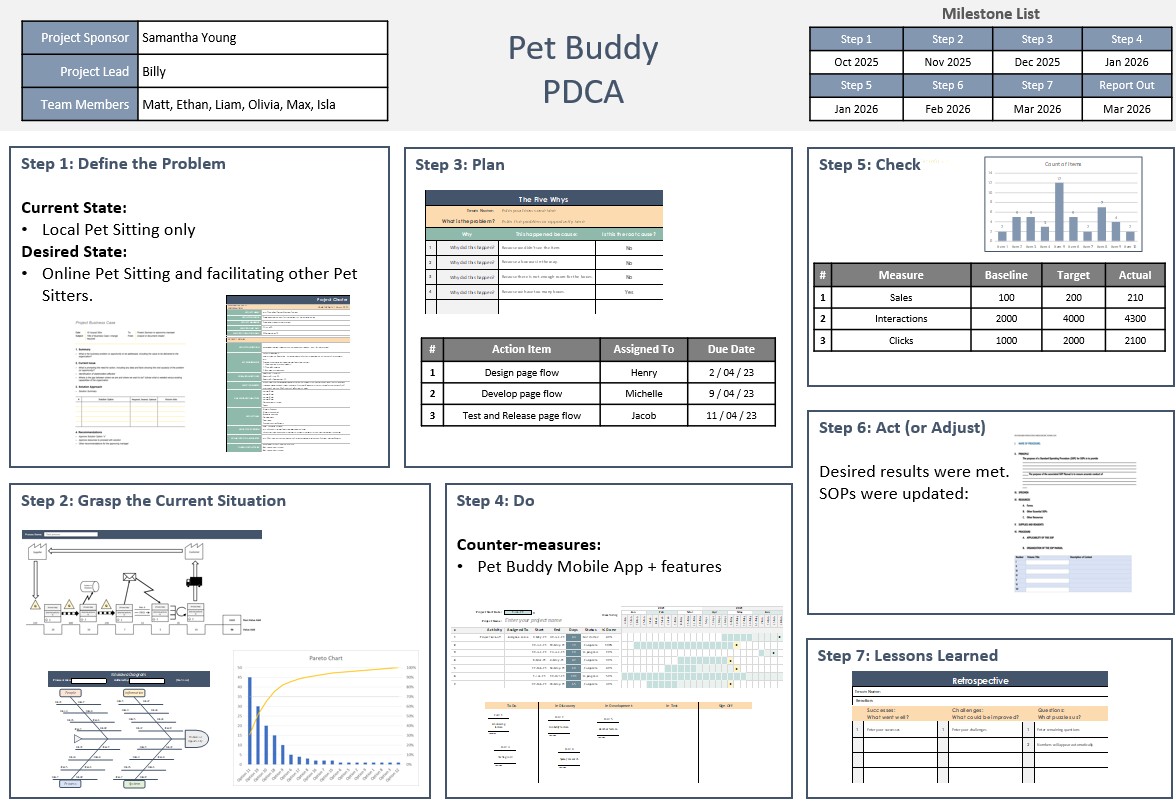
Welcome to this comprehensive video on 60+ essential project management tools that you need to know for success in your projects and on your PMP Exam! In this video, we’ll take a deep dive into these tools, using a real-world example to bring them to life. Our example project involves Pet Buddy, a business aiming to create the “Uber for pet sitters.” Samantha, the business owner, will work with her project team to gather requirements and deliver a mobile app that connects trusted pet sitters with pet owners.
Throughout the video, we’ll walk through the project lifecycle from start to finish, covering each phase — from initiation, scope, schedule, and budget, to quality management and risk mitigation. Each tool will be explained in the context of Pet Buddy’s project, making it easier to see how they can be applied in real-world scenarios.
As we move through the video, we’ll also introduce the tools, how to use them and where they belong.
Whether you’re studying for the PMP exam or just looking to improve your project management skills, this video will provide a solid foundation for mastering the 60+ Project Management tools you need to know. Let’s get started!
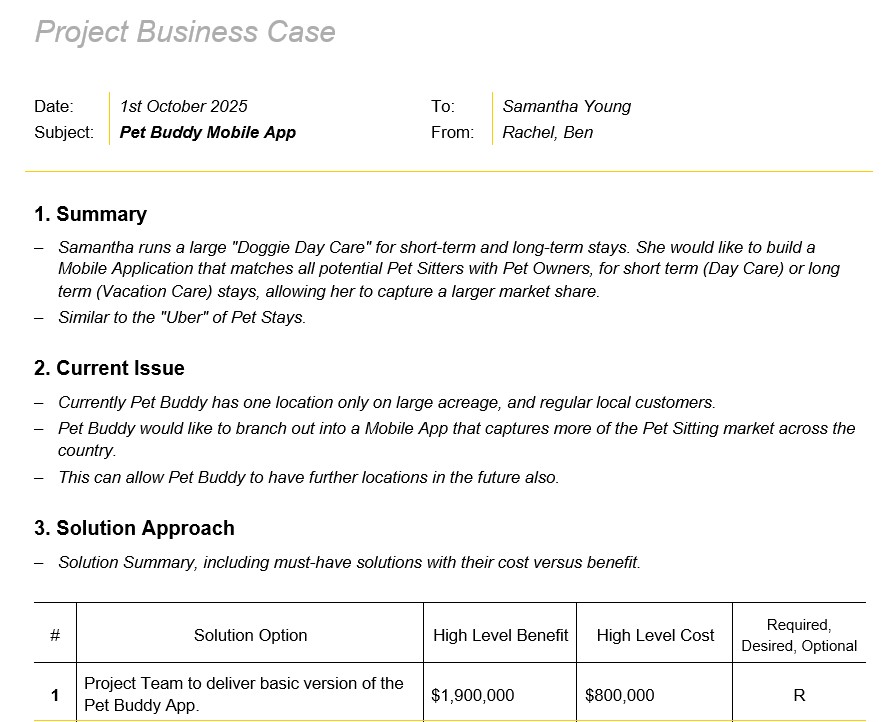
1. Business Case
The business case assesses whether the project is viable and worth pursuing. In our example, it includes:
Summary: Pet Buddy aims to expand its current daycare service through a mobile app.
Current Issue: Limited to a single location, the business seeks to scale through technology.
Solution: Develop an app for pet sitters and pet owners.
High-Level Costs: $800,000 for development.
Projected Benefits: $3.9 million in revenue over three years.
Recommendation: Move forward with development.
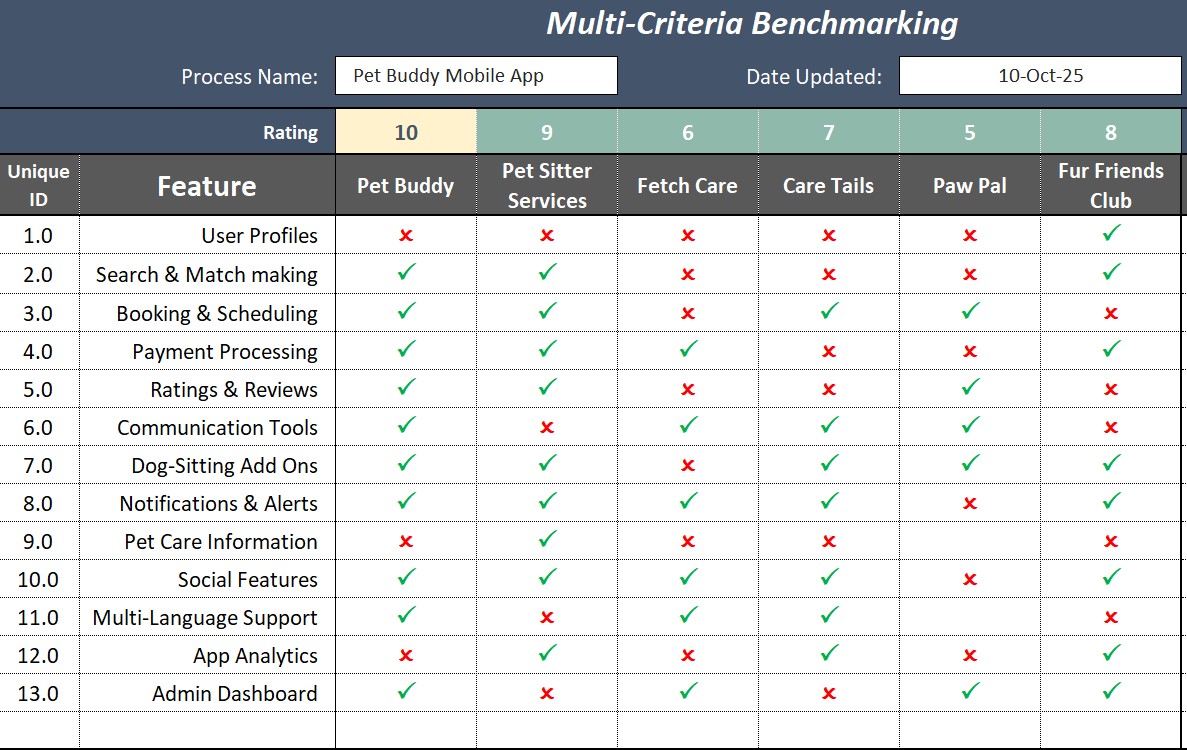
2. Benchmarking
Benchmarking evaluates competitors and market trends to determine if the project offers a competitive advantage. In our example for Pet Buddy we might include:
Competitor Analysis: Identifies competitors lacking features like social features, detailed sitter profiles, and add-on services.
Feature Comparison: Helps position Pet Buddy for differentiation.
Market Fit Assessment: Determines key improvements needed to outperform competitors.
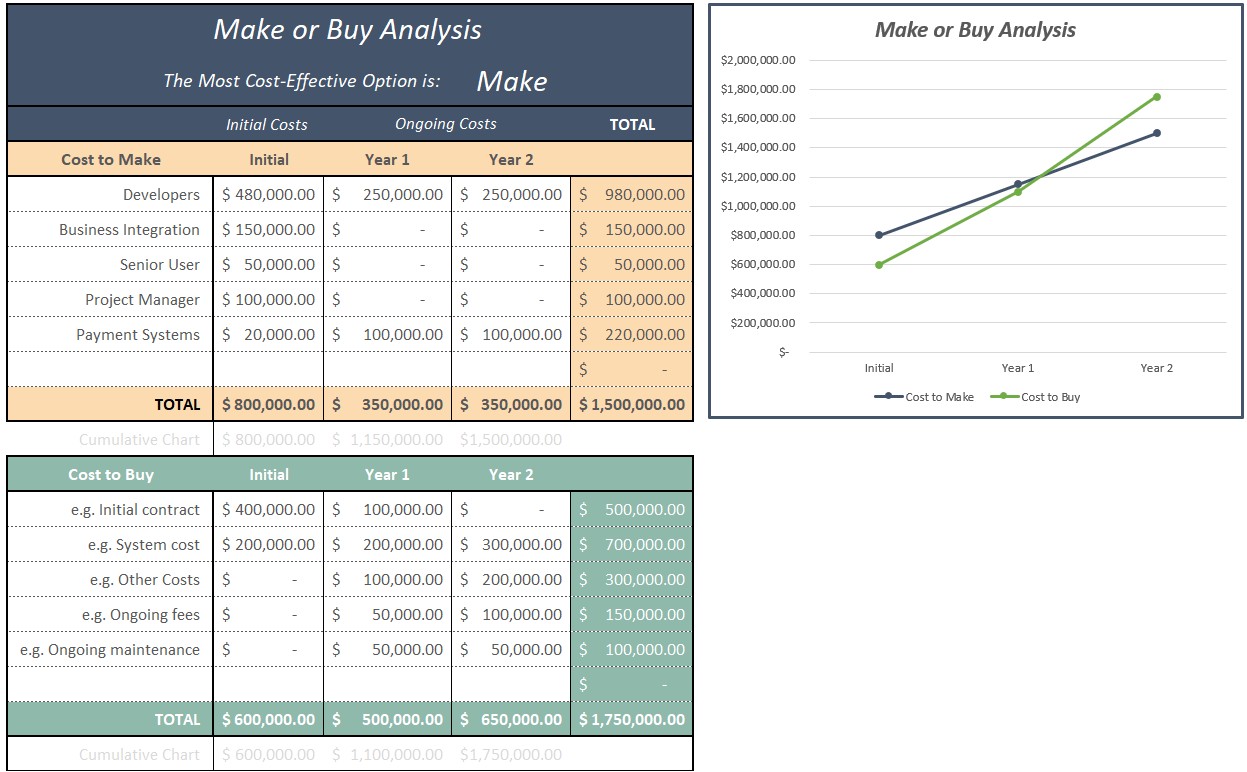
3. Make or Buy Analysis
This document assesses whether to develop the project internally or outsource it. In our example, we look at:
Cost to Make: $800,000 initial cost, $350,000 annual maintenance.
Cost to Buy: $600,000 annually for white-label solutions.
Conclusion: In this situation, in-house development becomes more cost-effective after two years.
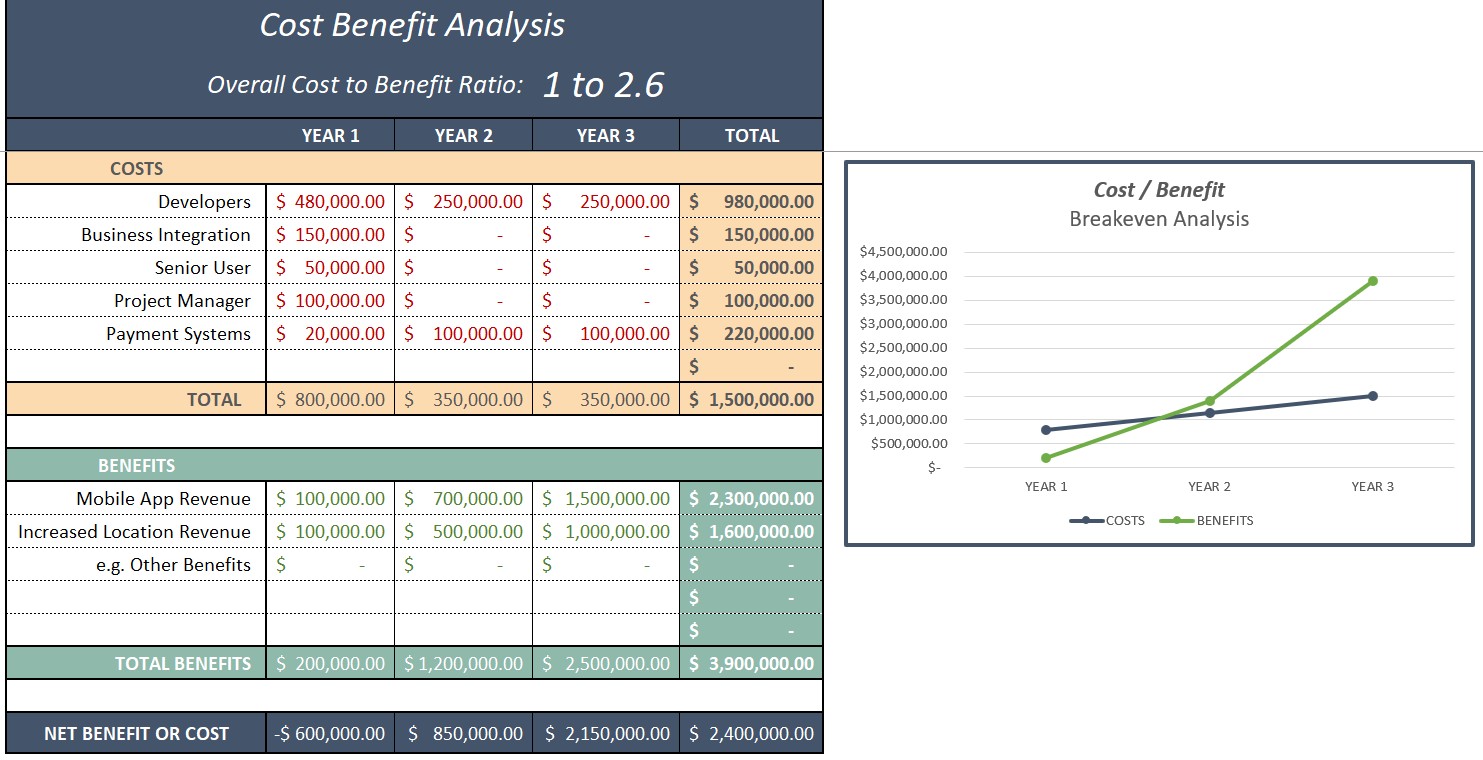
4. Cost-Benefit Analysis
Evaluates the financial viability of the project. For example:
Year 1 Costs: $800,000 (development, integration, project management).
Projected Revenue:
Year 1: Limited revenue.
Year 2: Significant growth.
Year 3: $3.9 million revenue.
Break-Even Point: Between years 2 and 2.5.
Benefit-to-Cost Ratio: 2.6 (favorable for investment).
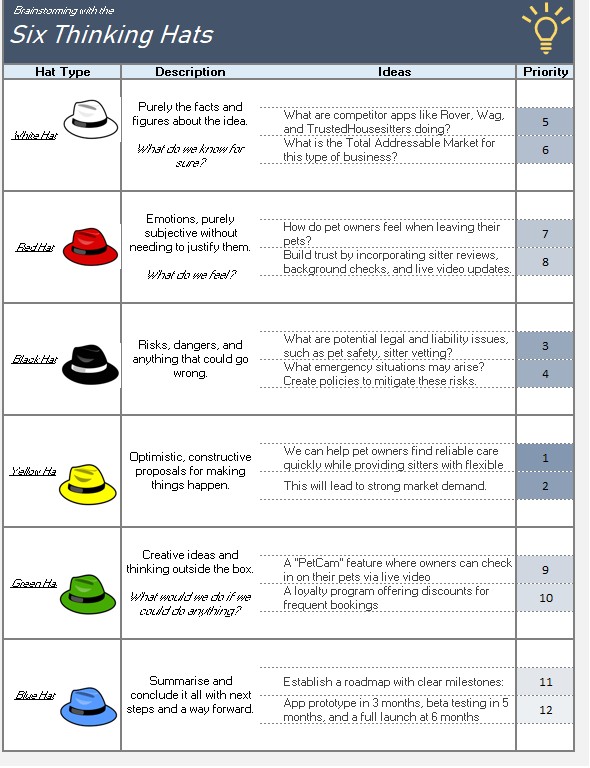
5. Six Thinking Hats
A brainstorming tool to assess different aspects of the project.
White Hat (Facts & Data): Market size, competitor analysis.
Red Hat (Emotions): Customer trust, sitter reliability.
Black Hat (Risks): Legal liability, emergency situations.
Yellow Hat (Opportunities): Increasing demand for trusted pet sitters.
Green Hat (Creativity): Loyalty programs, pet cameras.
Blue Hat (Summary & Next Steps): Action plan for moving forward.
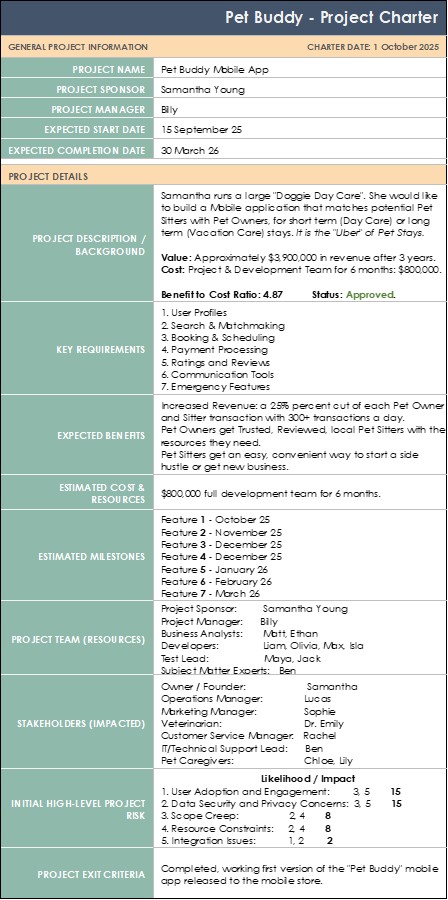
6. Project Charter
Defines the high-level scope, stakeholders, and objectives. In our example, we include things like:
Project Name: Pet Buddy Mobile App.
Project Sponsor: Samantha (Business Owner).
Project Manager: Billy.
Objective: Connect pet owners with trusted sitters.
Key Features: User profiles, scheduling, payments, messaging.
Estimated Cost: $800,000.
Risks Identified: Scope creep, data security, user adoption.
Completion Criteria: First working version launched in app stores.
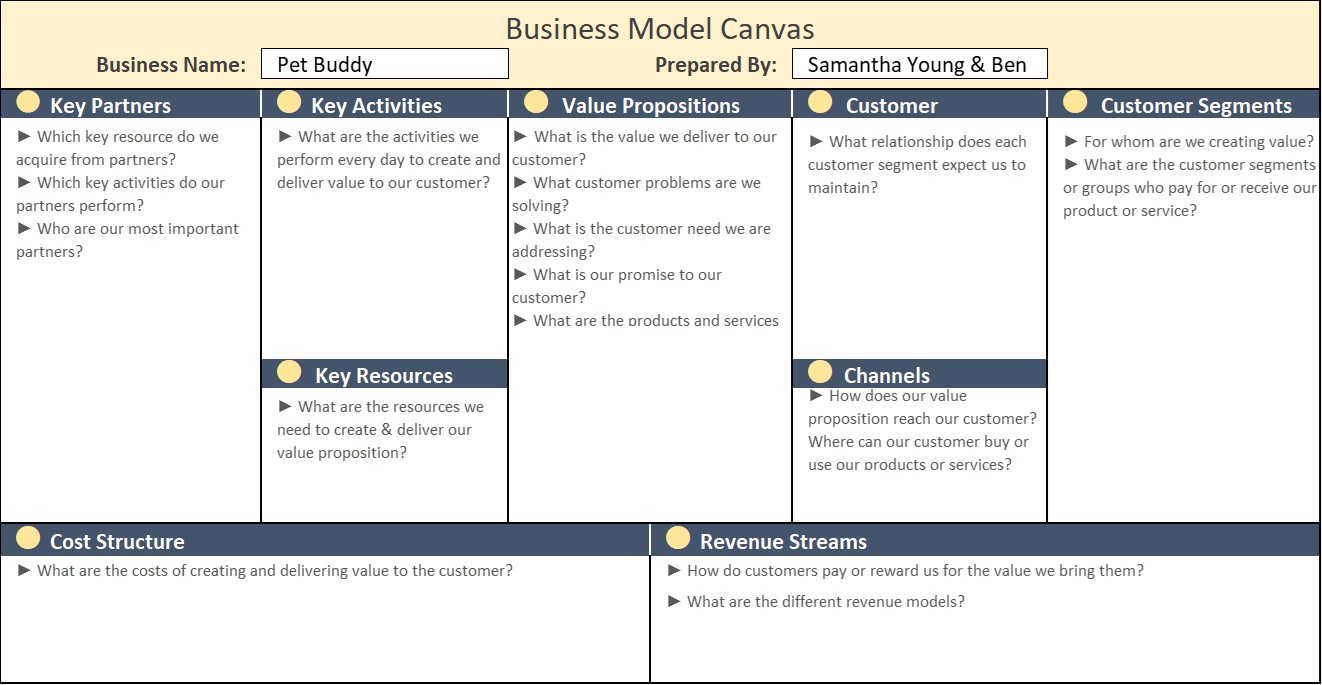
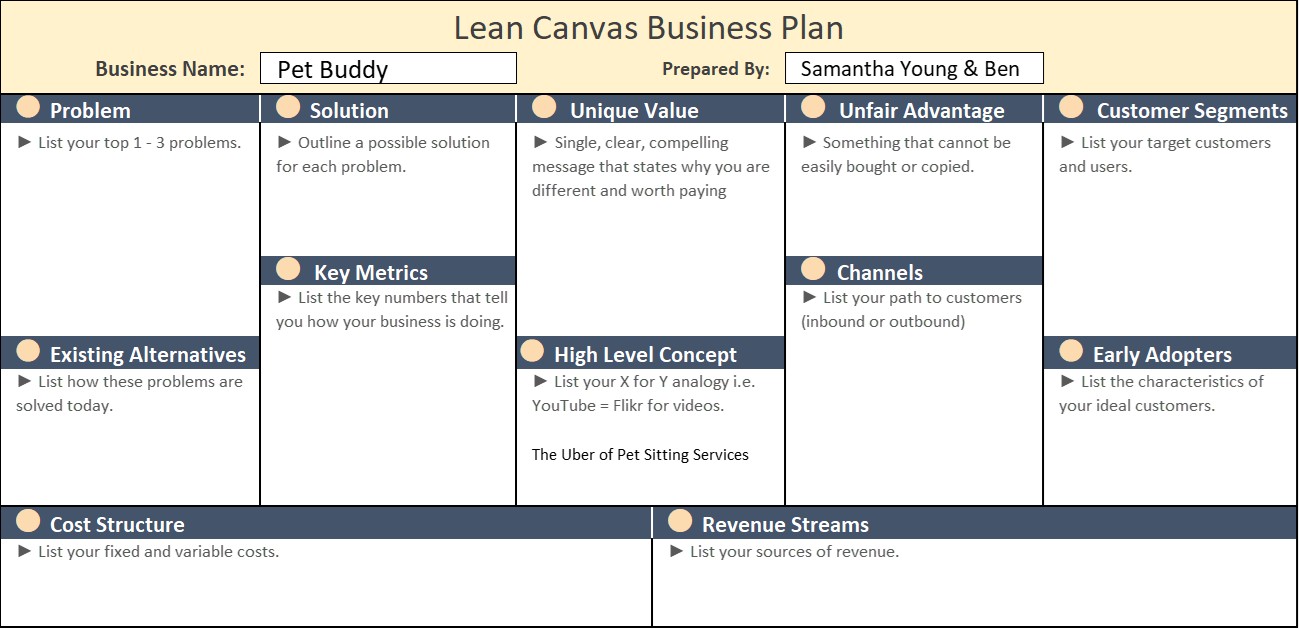
7. Business Model Canvas
A visual one-page plan to explore value creation and delivery, often used in Start-ups or for new products or features. It might include things like:
Customer Segments: Pet sitters, pet owners.
Value Proposition: Easy, trusted pet-sitting services.
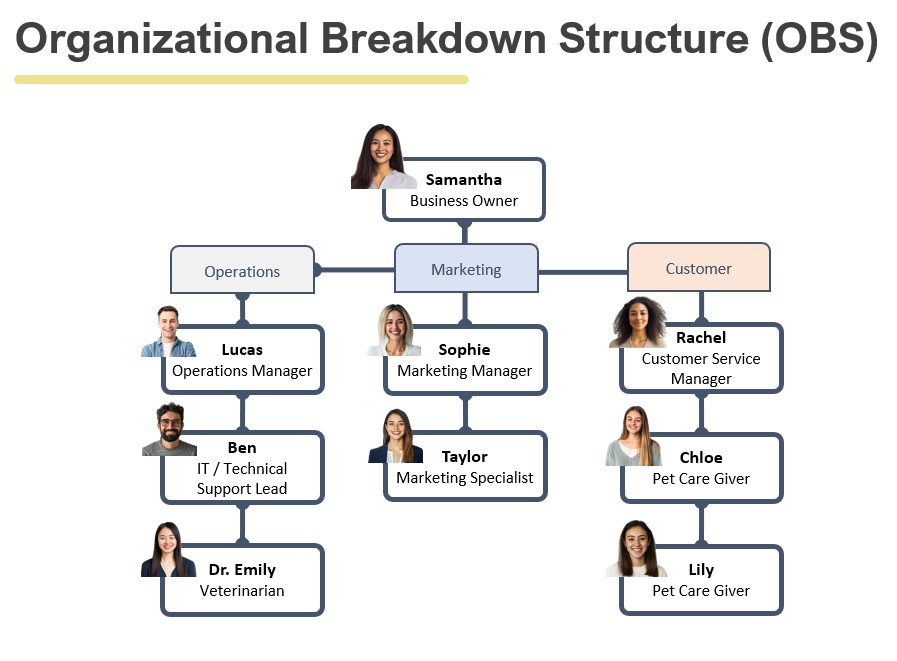
The first tool we’re looking at is the Organizational Breakdown Structure (OBS), also sometimes referred to as an organizational chart. This is an incredibly helpful tool when you’re trying to identify stakeholders within the business. For Pet Buddy, the project sponsor is Samantha, the business owner, and at the top of the structure, she leads the project.
The OBS helps us understand the hierarchy and responsibilities within the organization so we can identify the right stakeholders who will be impacted by or have influence over the project. As you start a project, it’s crucial to look at the organizational structure to ensure you’re engaging the right people.
12. Resource Breakdown Structure (RBS)
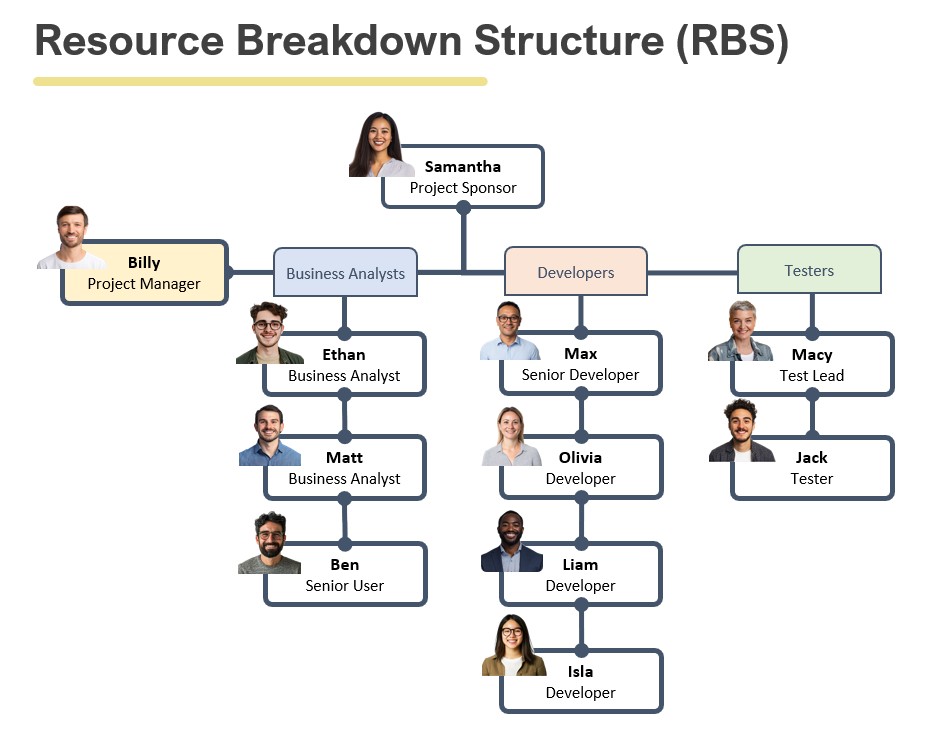
Once we’ve pinpointed our key stakeholders, we move on to forming our project team. Here, we use the Resource Breakdown Structure (RBS), which is essentially an outline of all the resources needed for the project – whether human or material. In this case, it’s our team, and we can break down the specific roles within the project team and clarify their responsibilities.
For the Pet Buddy project, we have our project sponsor, Samantha, along with our project manager (Billy), business analysts, developers, and testers. By organizing our resources clearly through the RBS, we ensure that everyone knows their role, responsibilities, and contributions. This structured approach makes it easier to identify any gaps in resources as the project progresses.
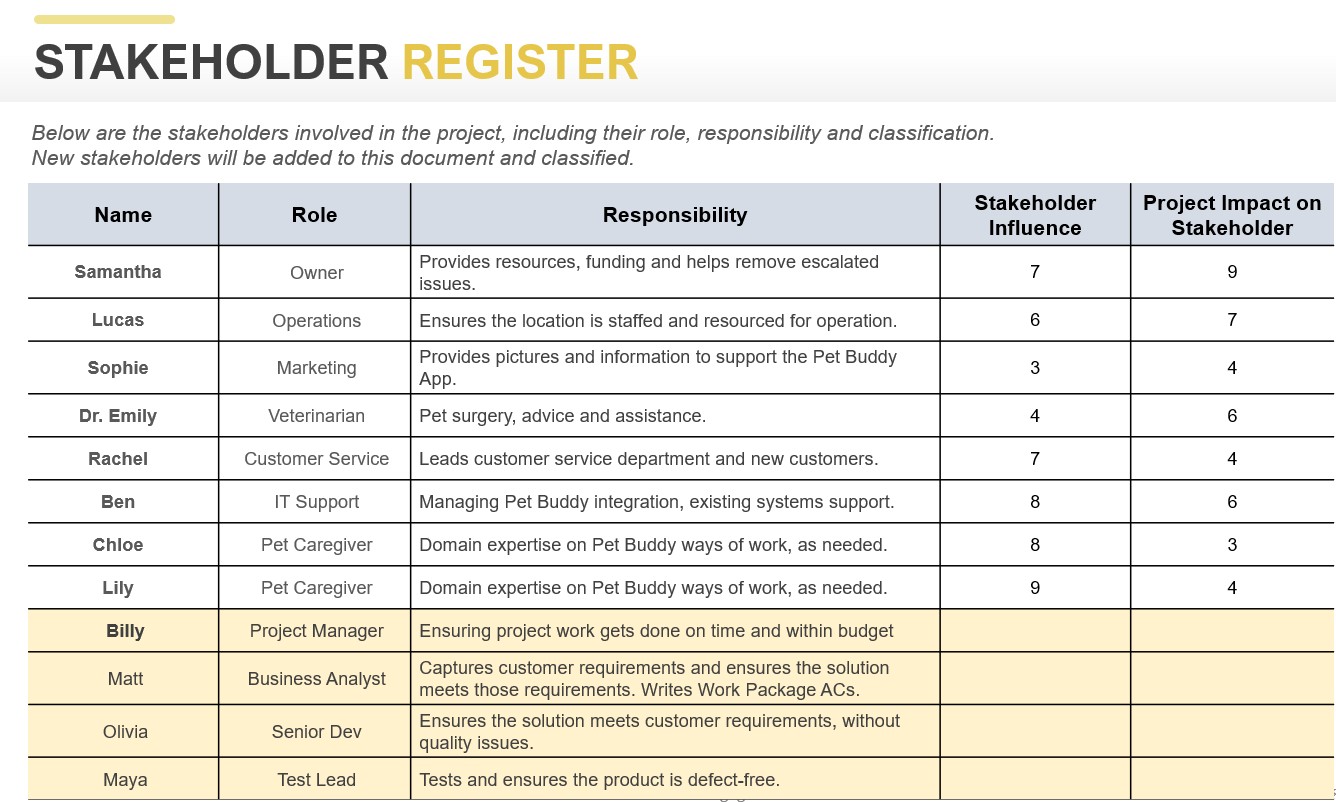
13. Stakeholder Register
After identifying stakeholders and forming our team, it’s time to capture all these details in the Stakeholder Register. The register includes each stakeholder’s name, role, and responsibility, and can also include their influence and impact on the project.
Take Samantha, for example – she is the project sponsor, and her role is critical, as she provides funding and resources and helps resolve escalated issues. Similarly, we’ll record the responsibilities of other stakeholders like those in Business Analysis, Testing, and Subject Matter Experts in operations and marketing or other business departments. In the register, we can also rate their level of influence and impact, usually on a scale from 1 to 10, to understand how much their involvement will affect the project.
14. Stakeholder Classification Matrix
Next we can use a Stakeholder Classification Matrix (also called a Stakeholder Map), which helps us categorize stakeholders based on any two critical factors: often their influence on the project and the impact the project is having on them.
For example, Samantha has both high influence and is also highly impacted by the project – she controls the resources and funding, and any changes will directly affect her. Conversely, someone in a front-line role, such as a customer service representative, may have high impact (the app affects their day-to-day work) but low influence on the project’s direction. The goal is to classify each stakeholder so that we can engage with them appropriately – collaborating closely with those who have high influence, keeping informed those who are impacted but have less influence, and monitoring those with lower levels of both.
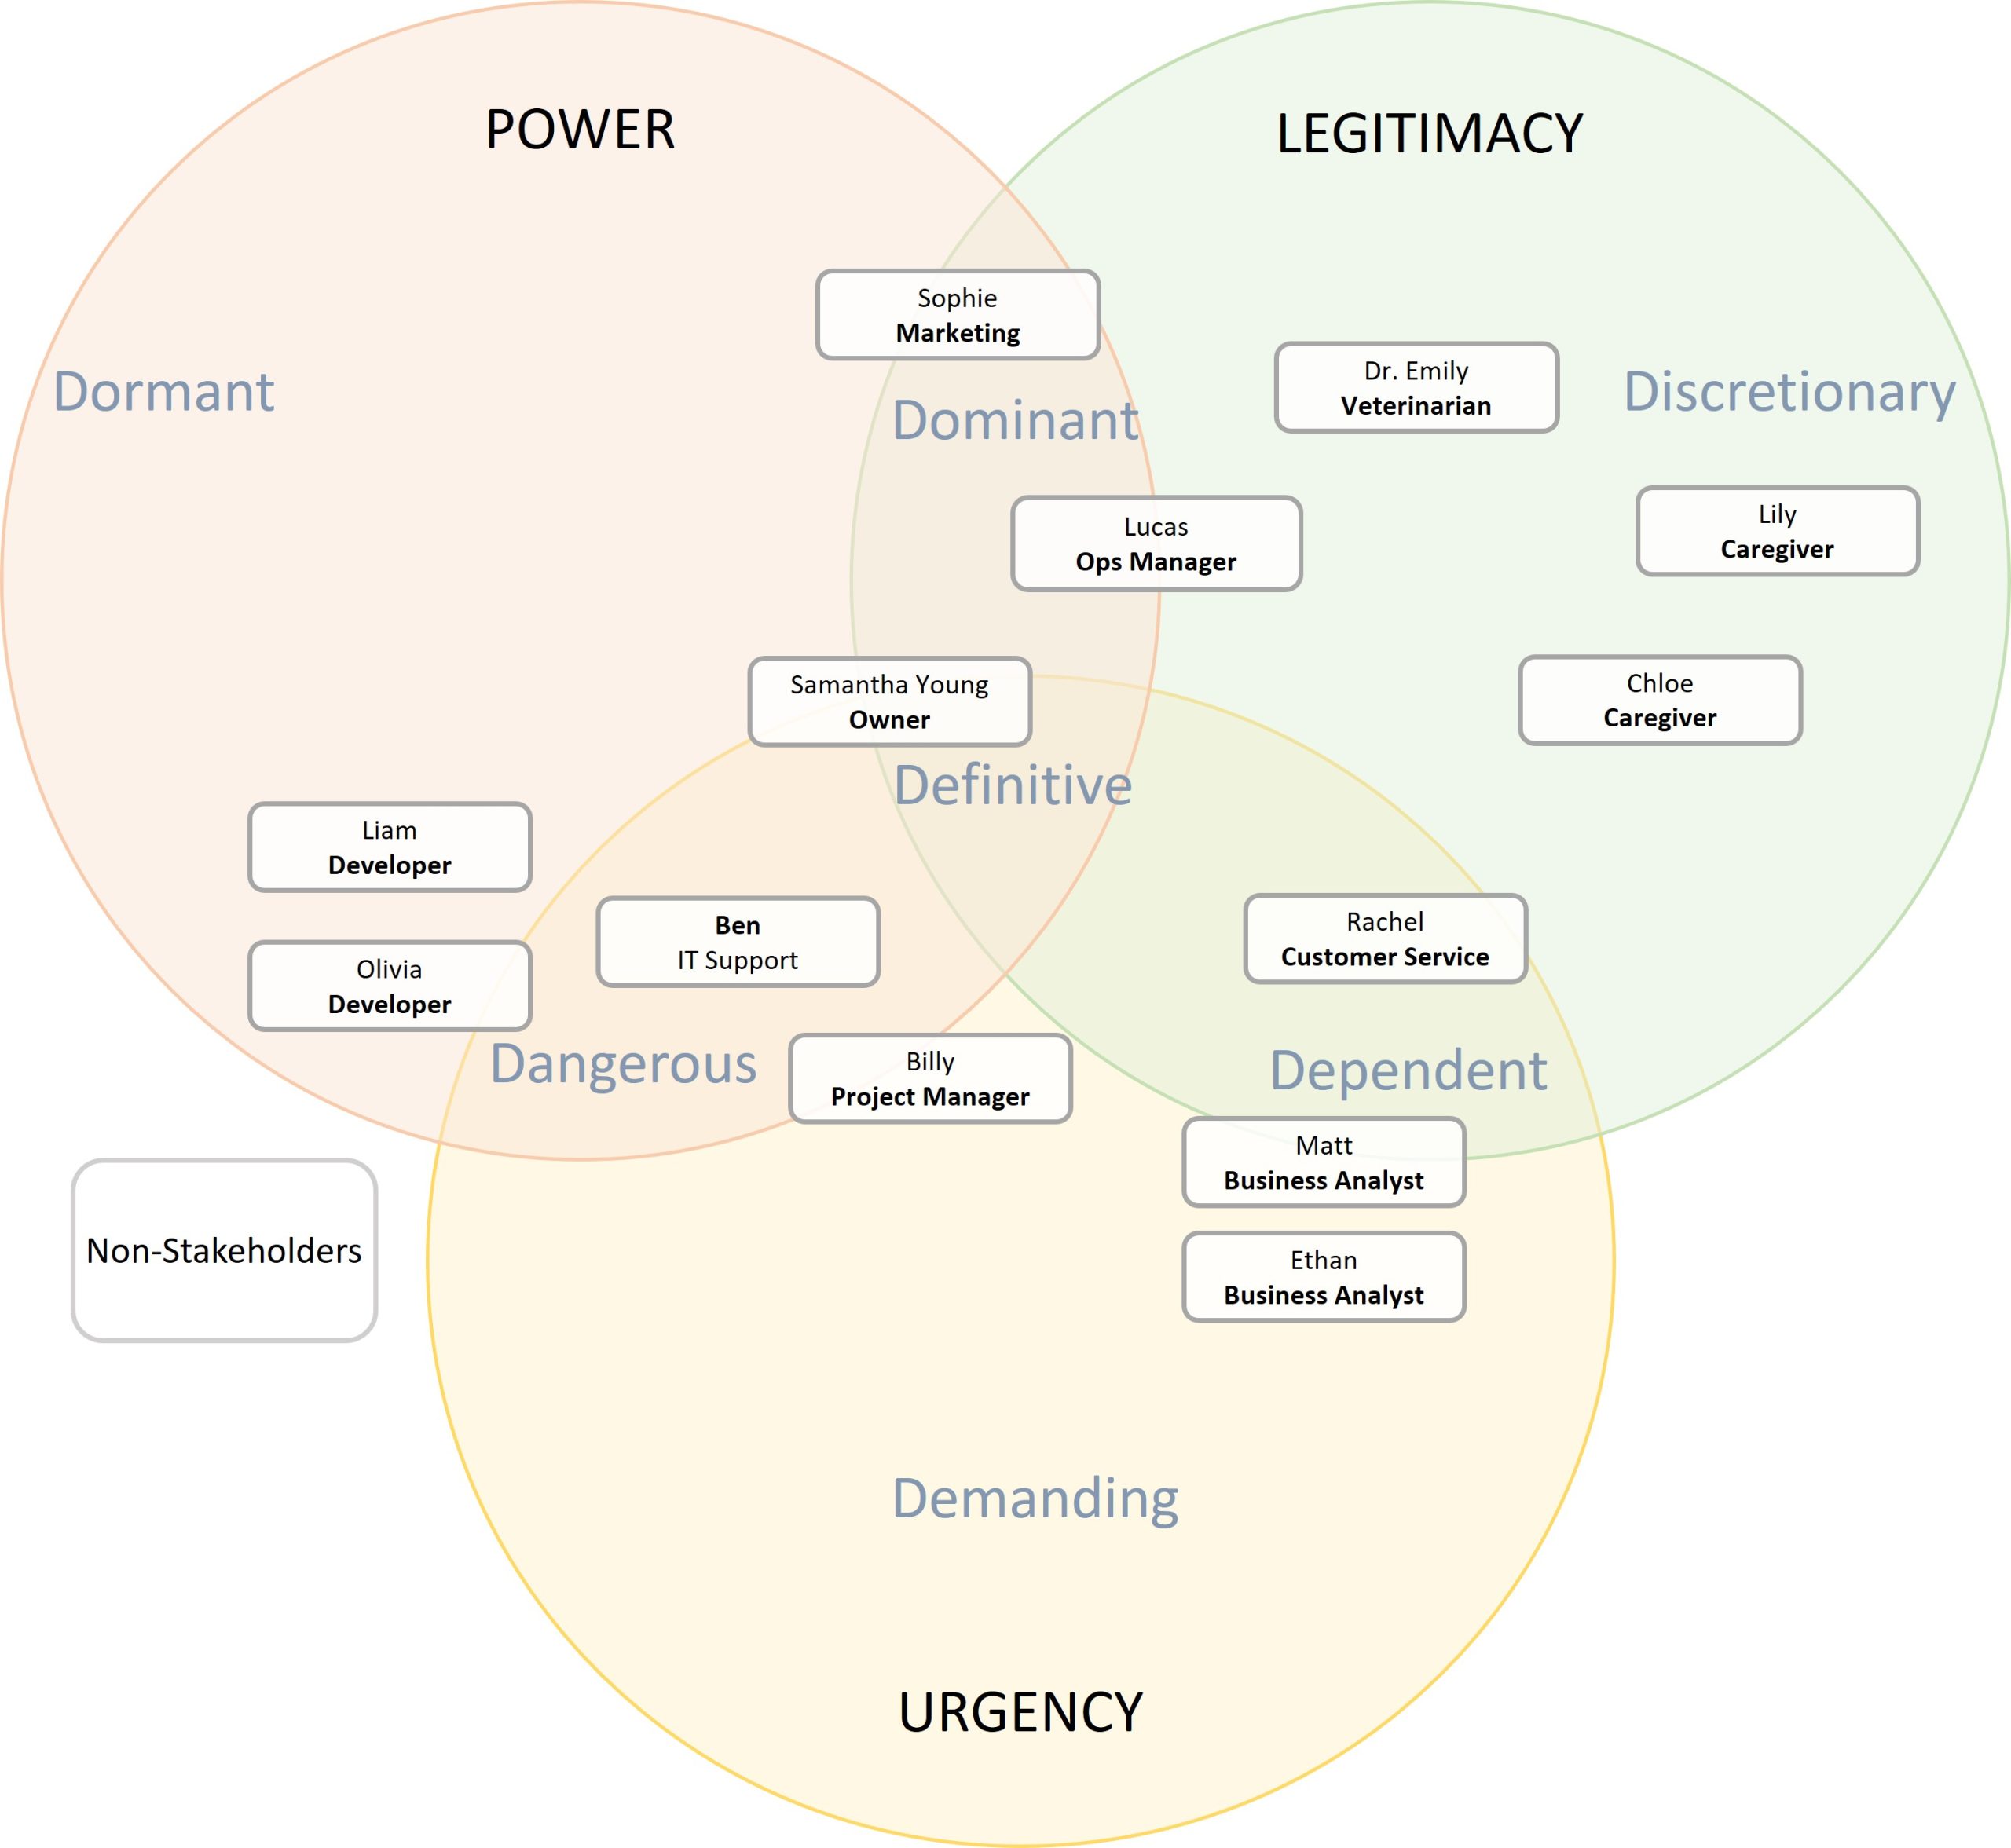
15. Salience Chart
Another tool you can use is the Salience Chart. This chart categorizes stakeholders based on three key factors: power, legitimacy, and urgency. Stakeholders who have all three -power to influence the project, a legitimate role, and urgent needs – are those you need to engage with the most.
The Salience Chart helps you prioritize which stakeholders require your attention at any given time. For instance, if a stakeholder has high power but low urgency or legitimacy, the information and frequency of the communication you give them may change. On the other hand, if they have all three factors, they are a “definitive” stakeholder, and you must engage with them actively. This chart is a great way to visualize stakeholder engagement and ensure you’re addressing the most critical ones first.
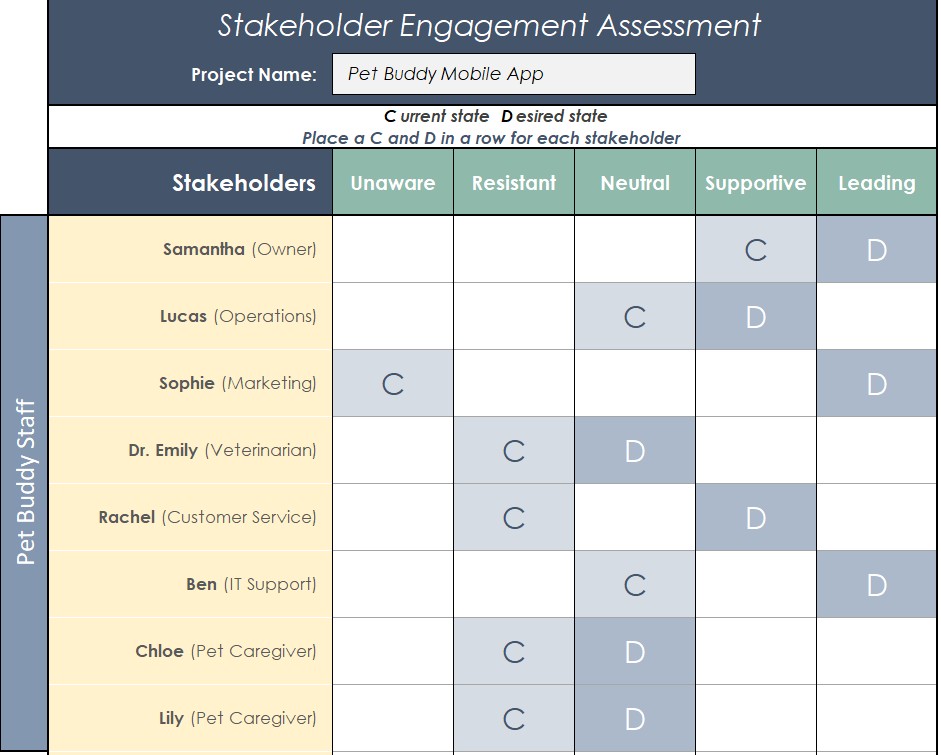
16. Stakeholder Engagement Matrix
Finally, we look at the Stakeholder Engagement Matrix, which helps assess how engaged your stakeholders are and how engaged they should be. This matrix compares the current state of stakeholder engagement with the desired state.
The options are Unaware, Resistance, Neutral, Supportive and Leading, and we rate them for their “Current” engagement, versus where we want them to be – their “Desired” engagement.
For example, if Sophie from marketing is currently unaware of the project but is crucial for launching the app, we need to move her from “unaware” to “leading.” Similarly, if Lucas from operations is neutral but we need him to be supportive, we’ll need to increase communication and collaboration with him to get him on board. The matrix ensures that you’re not only aware of the stakeholder’s current involvement but also actively working to move them toward the desired level of engagement.
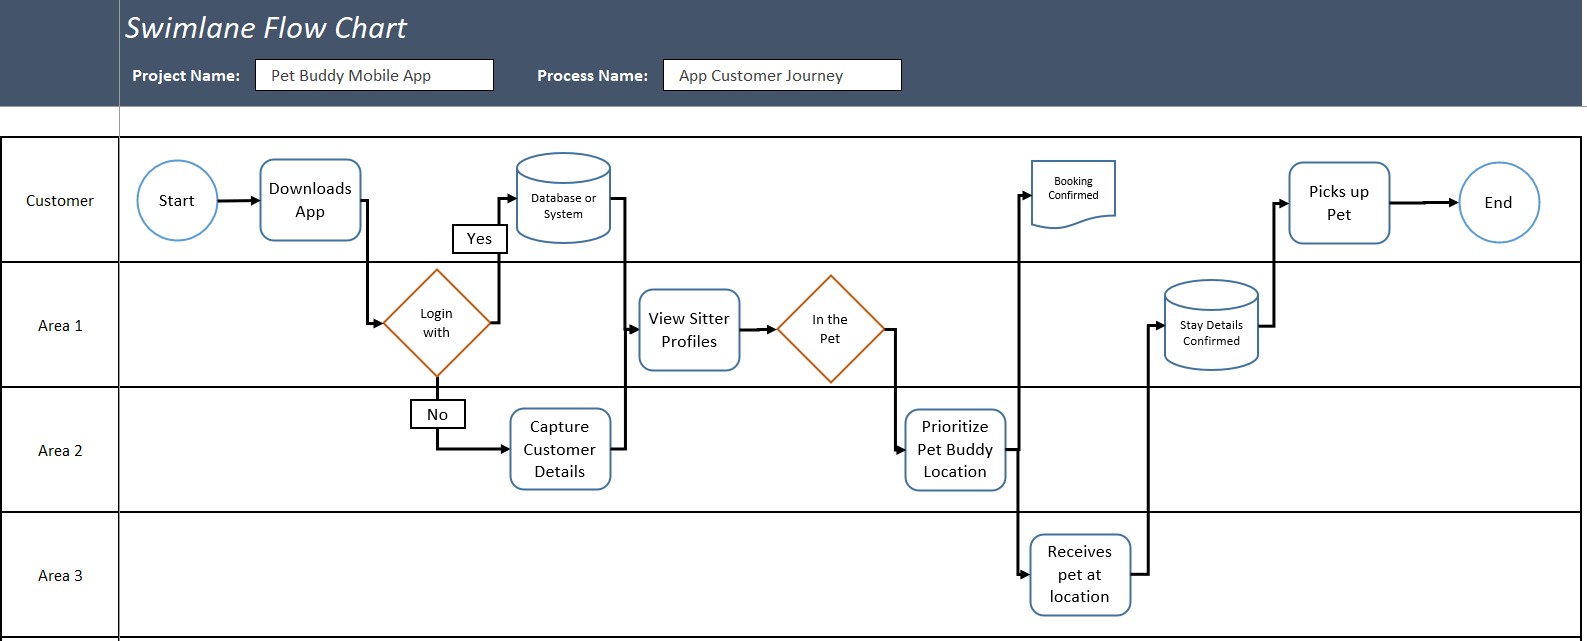
17. Swimlane Flowchart
The swim-lane flowchart is a simple yet powerful tool for visualizing a customer’s journey in a process. It divides the process into “swimlanes,” representing different departments, systems, or stages involved in the process. For example, in the Pet Buddy app project, you can visualize how a customer progresses from downloading the app to booking a pet sitter, interacting with the business at various points.
This is perfect for getting an idea of the current customer experience, or seeing the experience we want to design.
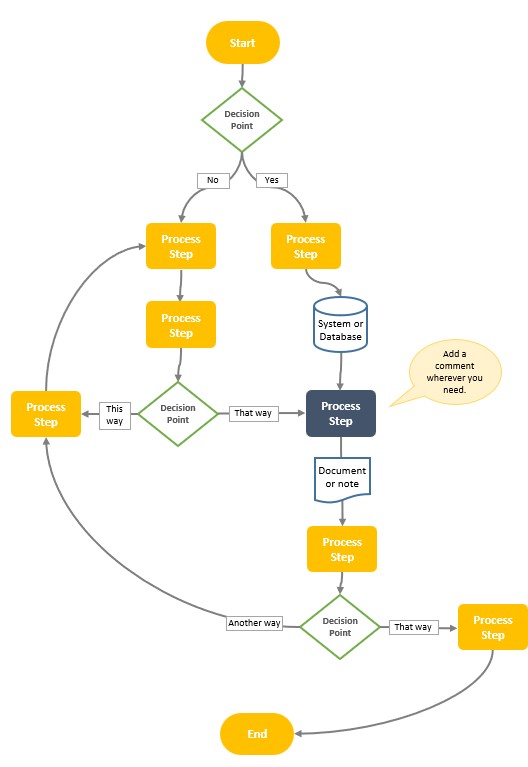
18. Simple Process Flowchart
This tool is a more straightforward flowchart, depicting processes from left to right, or from top to bottom. It simplifies the visualization of customer decisions and actions, highlighting process steps and decision points (usually represented by diamonds).
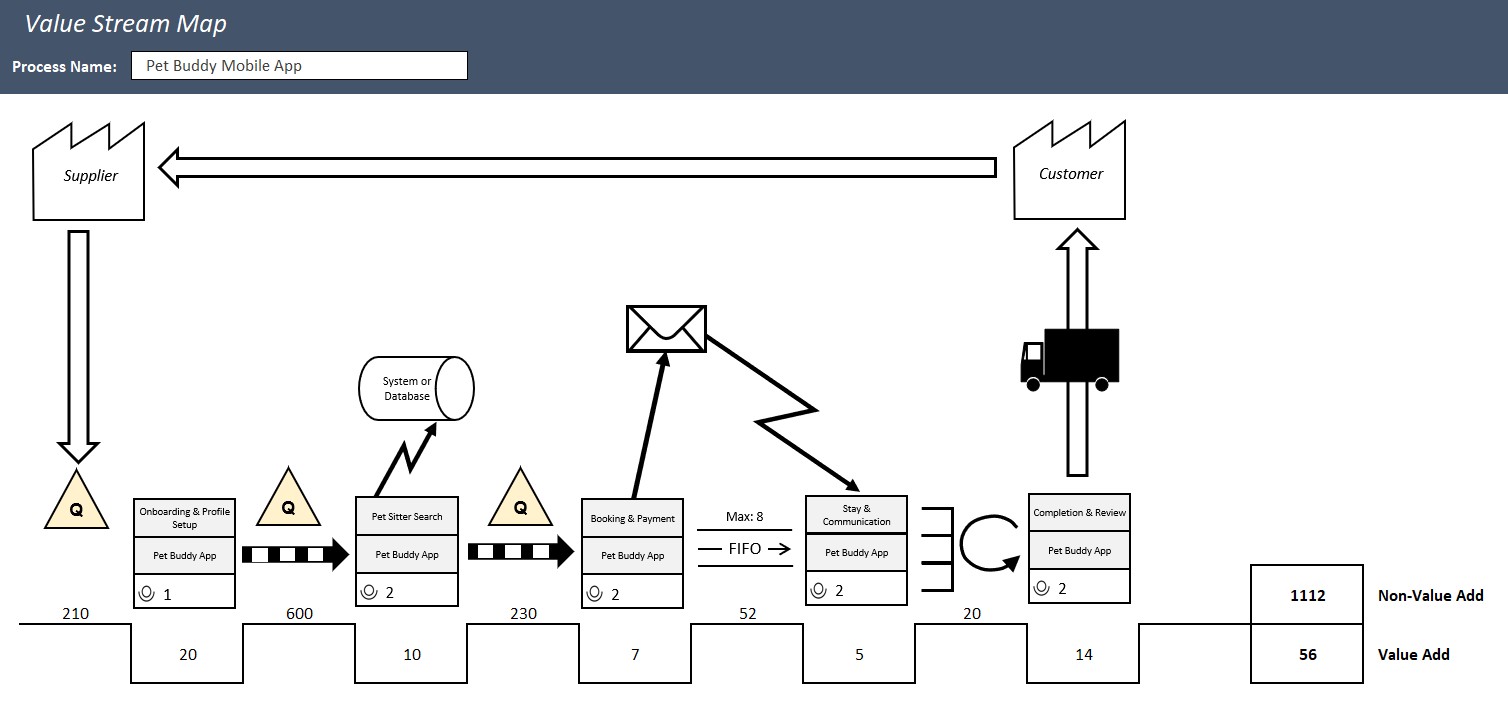
19. Value Stream Map
A value stream map helps track the flow of customer orders from start to finish while focusing on value-added and non-value-added time. By highlighting unnecessary delays or inefficiencies, it enables teams to streamline processes, adding more value to the customer while reducing waste. There are dozens of icons in a VSM, from supermarkets, queues, push and pull, messaging, databases, Kanban signals and more.
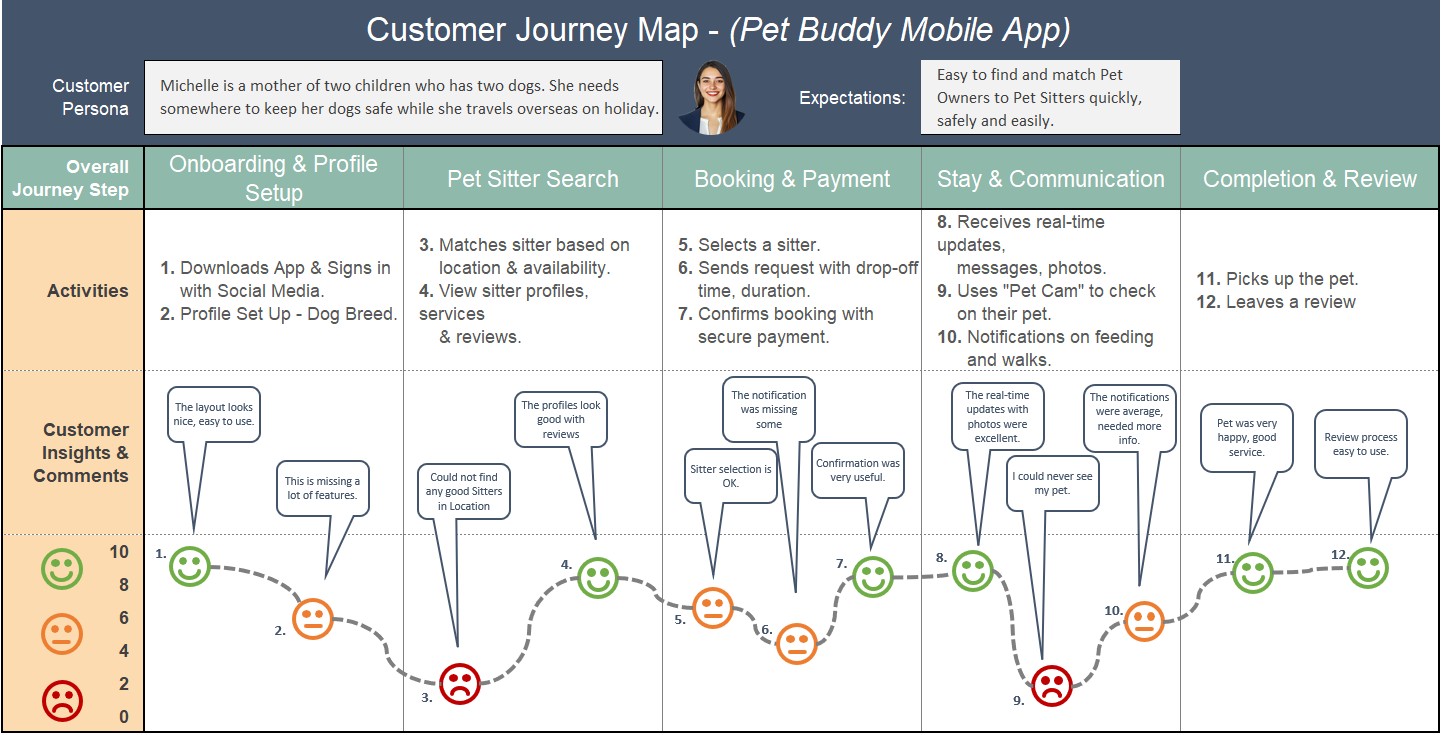
20. Customer Journey Map
Customer journey mapping outlines the specific steps customers take, alongside their emotional journey or how they rate each step for their satisfaction. For the Pet Buddy app, this could involve stages like downloading the app, setting up a profile, and booking a sitter. Mapping these touchpoints helps identify pain points and improve user experience.
It also includes our typical customer “persona” and what they typically want.
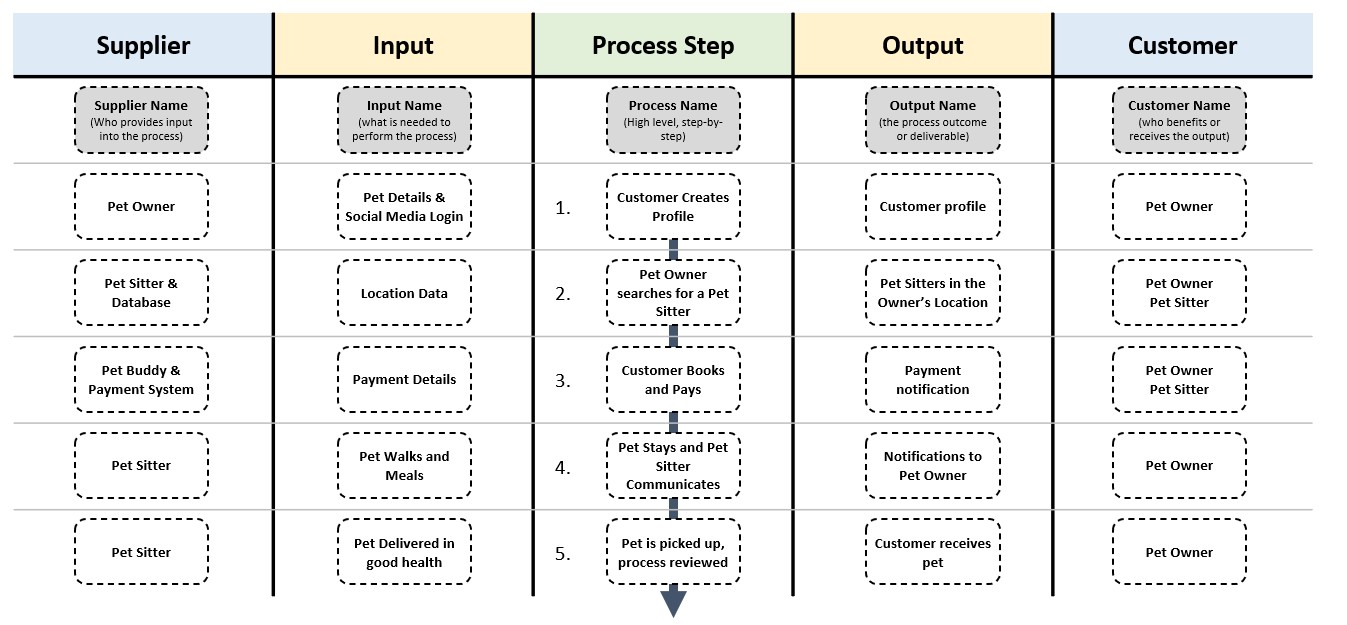
SIPOC is a tool used to map out processes, emphasizing the suppliers, inputs, processes, outputs, and customers. In the case of Pet Buddy, this tool would help clarify the sequence of steps needed to book a pet sitter, who the suppliers are for that process step (e.g., customer databases or payment systems), and who the customers are (e.g., pet owners or sitters, or whoever gets the benefit of that process step).
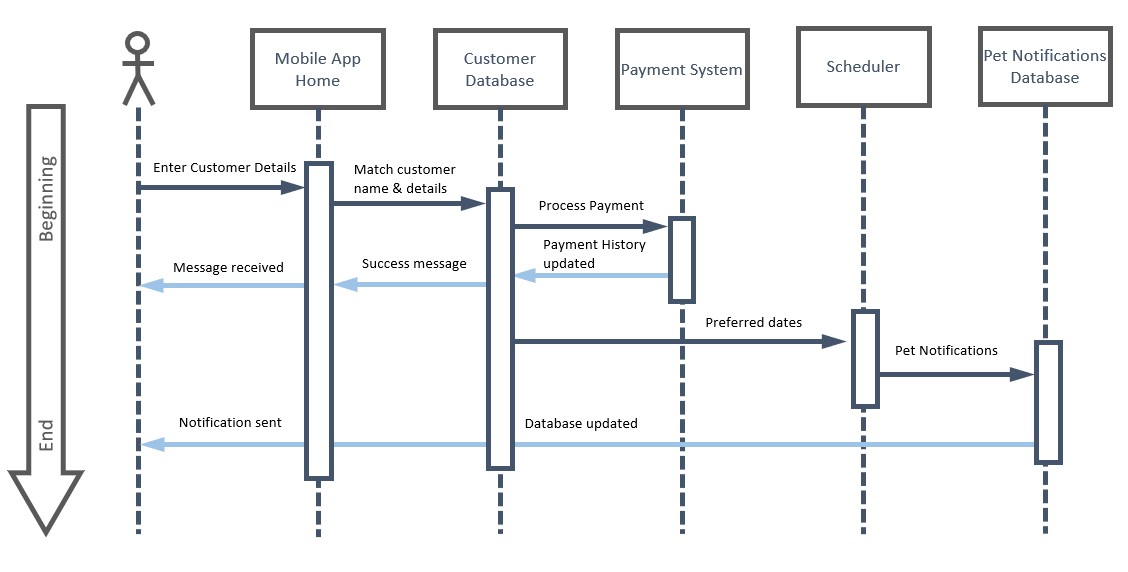
22. UML Sequence Diagram
A UML sequence diagram models how information flows through a system, across its different code classes or connecting systems. It’s particularly helpful for visualizing the interactions between users and the systems involved. For Pet Buddy, this could show how customer data flows through various subsystems like payment processing, notifications, and booking.
This is a great architecture diagram to figure out what the current system looks like, or what we want it to look like in the final product.
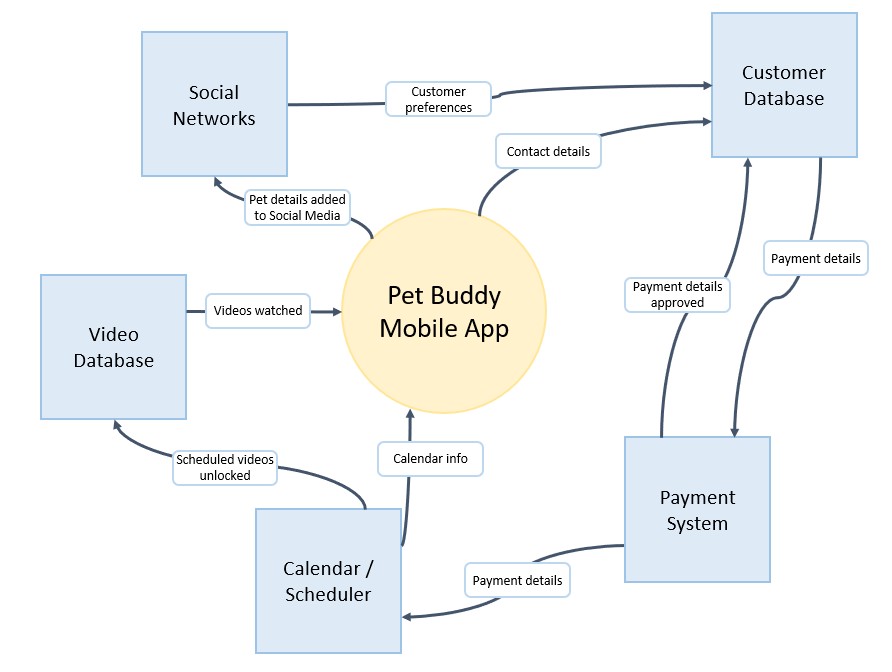
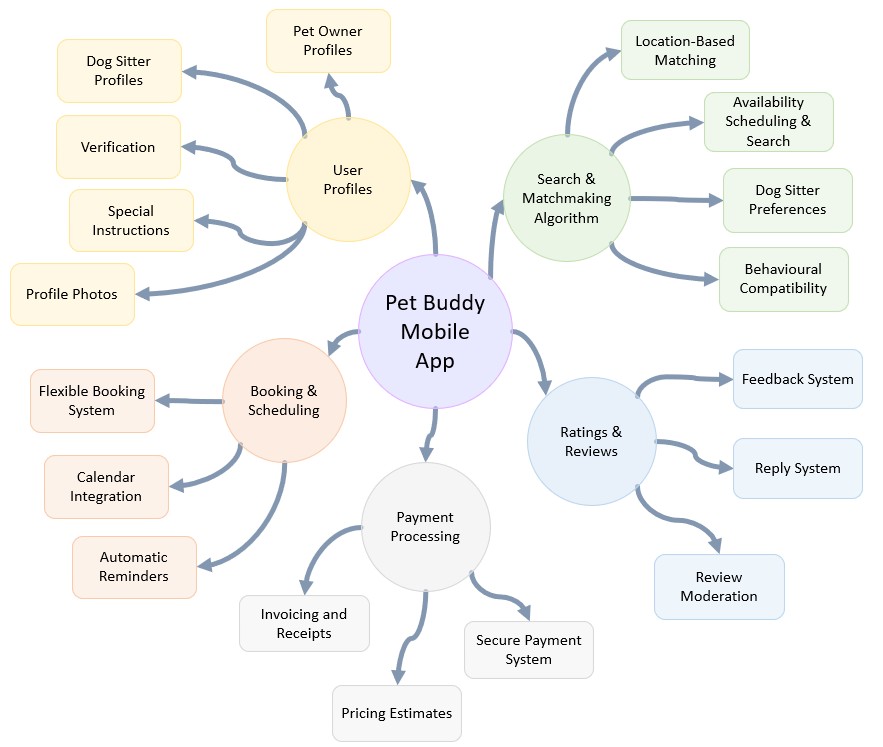
23. Context Diagram
A context diagram provides a bird’s-eye view of how the systems within a project interact with each other – with simple Circle as the main system, and boxes surrounding it to show what information flows where.
This is a great tool for understanding the architecture of the Pet Buddy app, depicting how the mobile app connects with other systems such as payment gateways and customer databases.
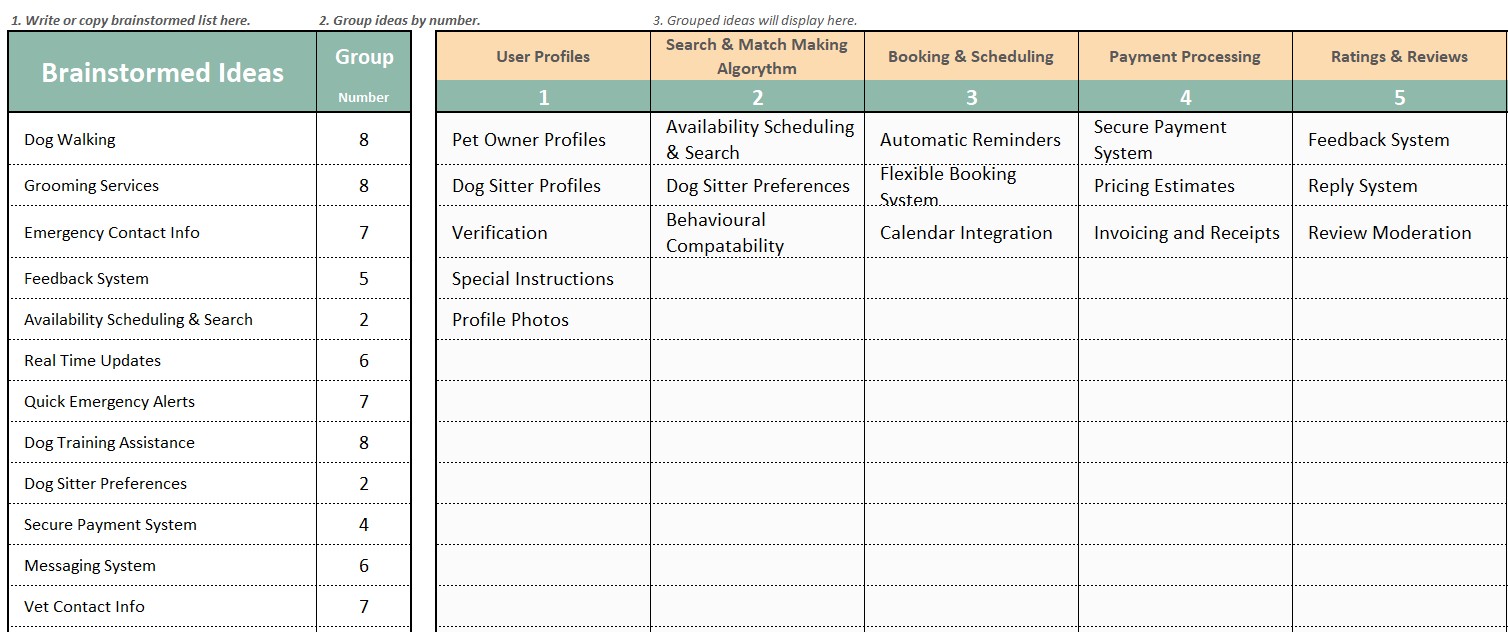
24. Brainstorming & Grouping
Brainstorming with our team helps generate ideas, which are then grouped into categories based on their similarities. This allows teams to prioritize their thoughts and ideas effectively, especially for meeting the customer requirements with our project scope.
For Pet Buddy, brainstorming might lead to ideas for new features, which can then be grouped by functionality (e.g., user profile management, payment processing).
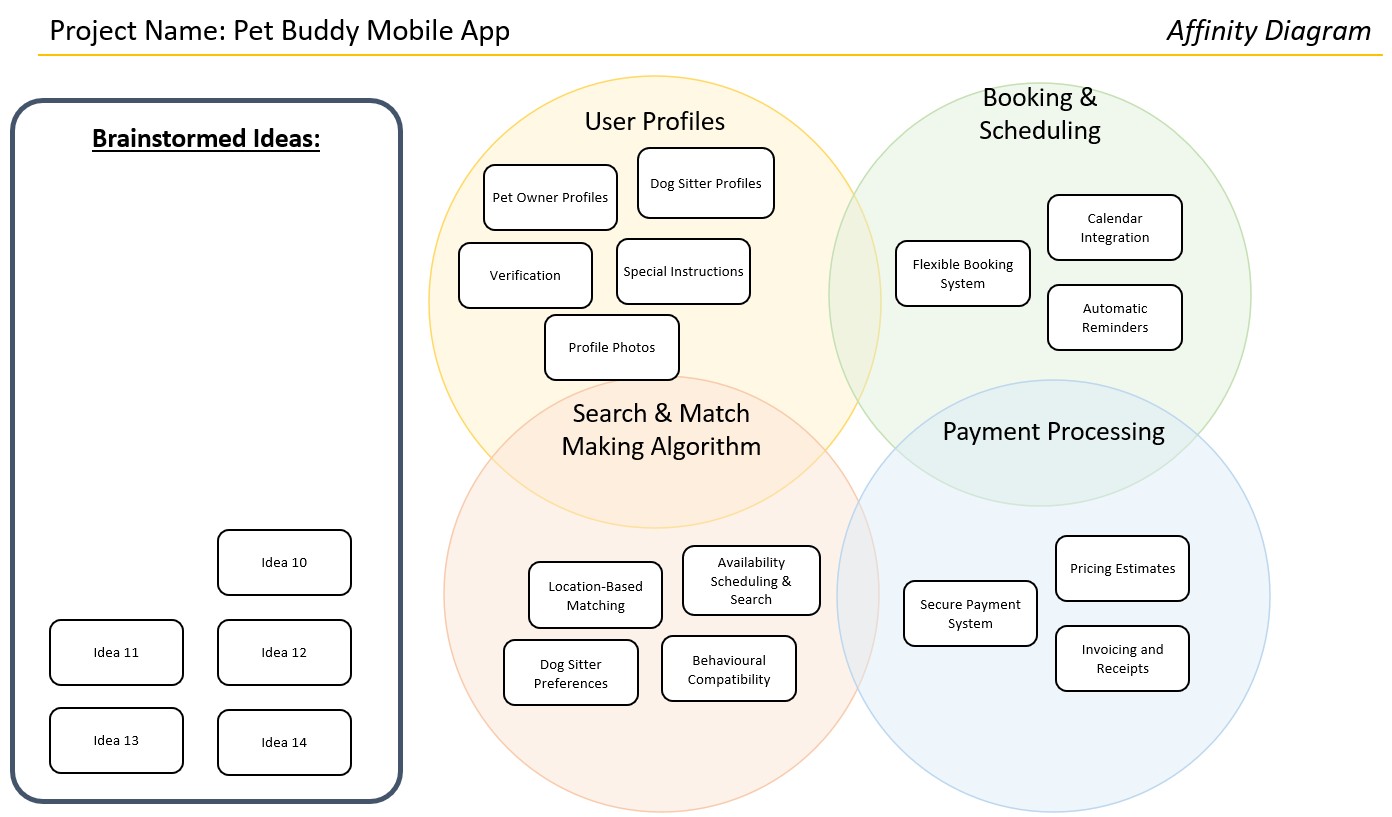
25. Affinity Diagram
The affinity diagram is an extension of brainstorming, grouping ideas that are related in a visual manner – with an “affinity” to each other. This tool is helpful when organizing and categorizing ideas, making it easier to see patterns and prioritize tasks that will best meet customer requirements.
26. Nominal Group Technique
The nominal group technique is a structured method for brainstorming that encourages anonymous idea generation. The team write their ideas then they are revealed together, ensuring the highest paid person or the loudest person in the room doesn’t influence their ideas.
This ensures that all team members have an equal say, and it can help prioritize features, with team members anonymously voting on which ideas are most critical for the success of the Pet Buddy app.
27. Mind Map
A mind map is a visual representation of ideas, with the central concept at the core and branching out into related topics in smaller and smaller pieces – decomposing similarly to a Work Breakdown Structure.
For scope management, it’s a great way to break down complex topics and see the bigger picture. For Pet Buddy, a mind map might break down the app’s features like matchmaking, booking, and payment processing into smaller Work Packages and even activities.
28. Requirements Traceability Matrix
The requirements traceability matrix is an essential tool for ensuring that project scope aligns with original customer requirements. It tracks the relationship between requirements, features, and user stories, and quality test cases ensuring that every need is met in the final product.
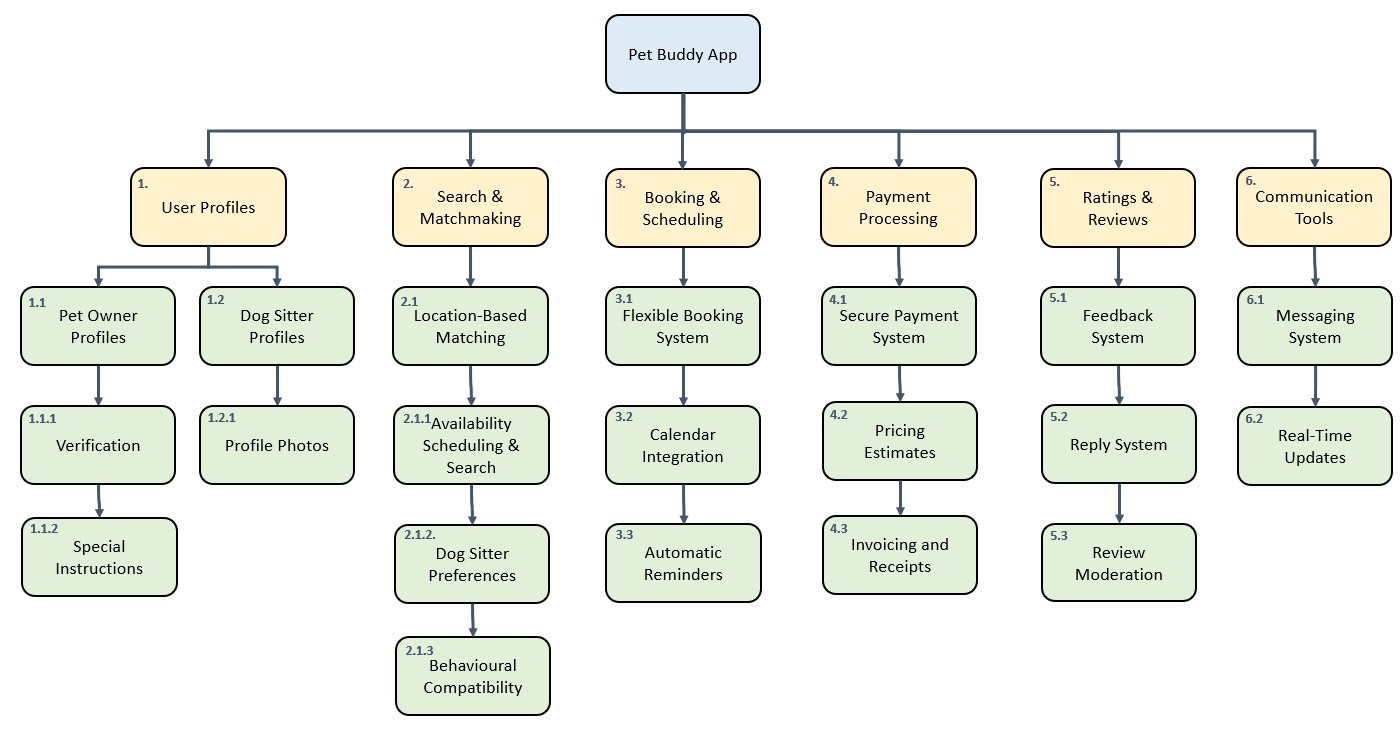
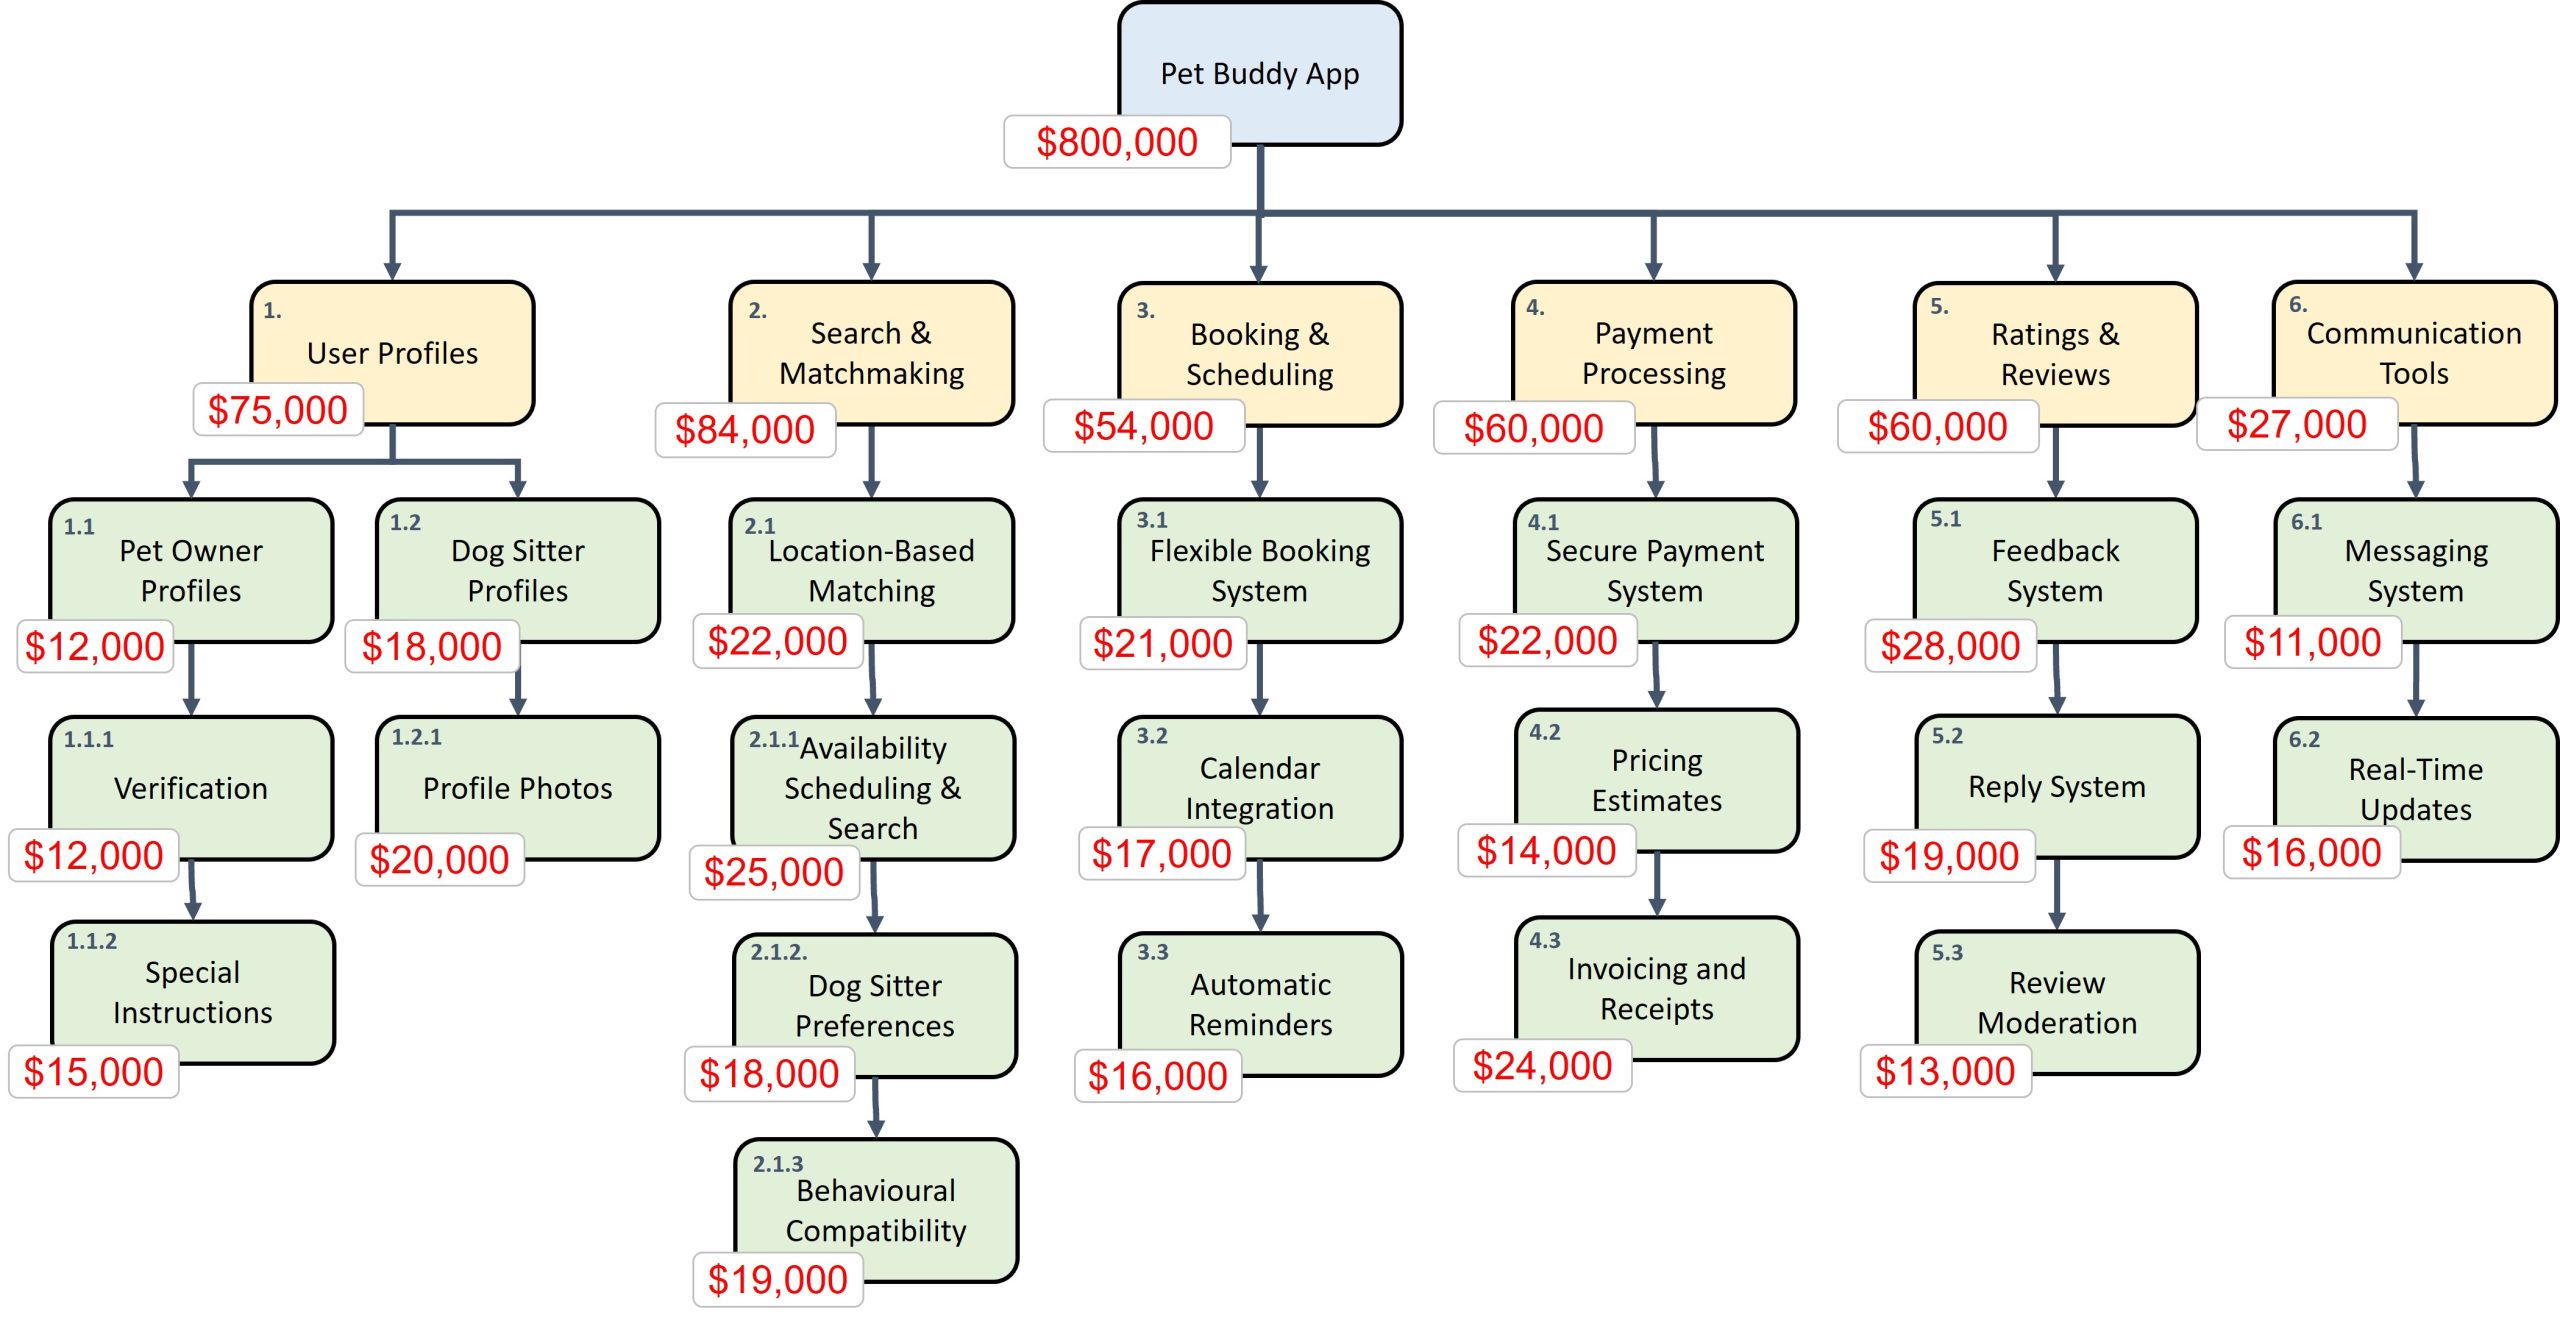
29. Work Breakdown Structure (WBS)
The WBS is a hierarchical structure that breaks down the project scope into smaller, manageable components. For Pet Buddy, this might include categories such as user profiles, booking features, and payment integration, and smaller work packages or activities.
The WBS enables a clearer breakdown of the project scope, so we can schedule and assign it better.
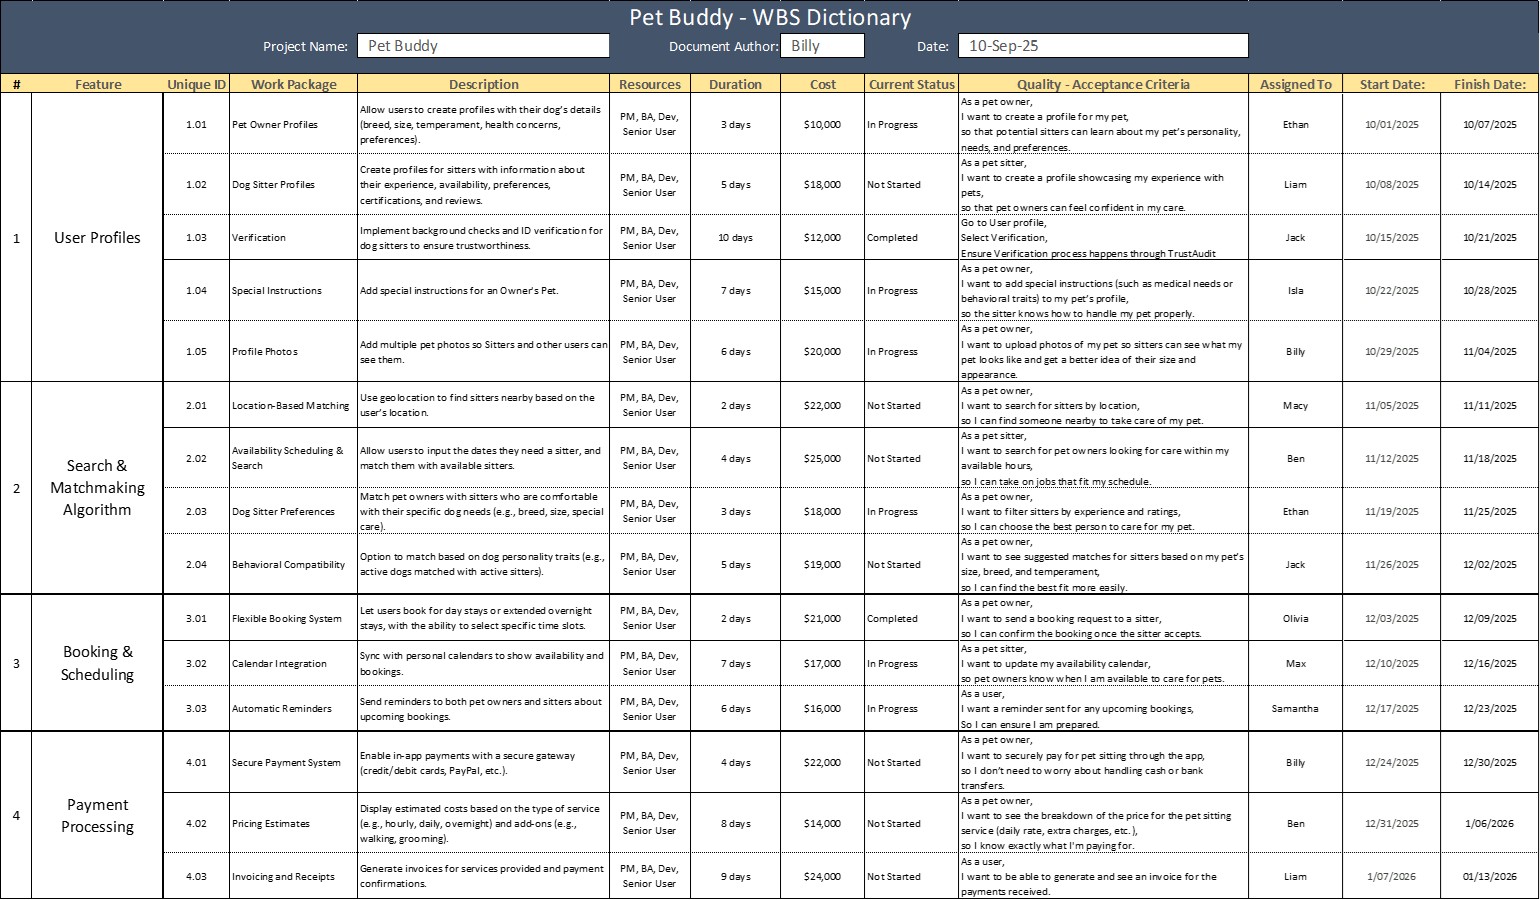
30. WBS Dictionary
The WBS dictionary provides detailed information about each item in the WBS, including descriptions, durations, costs, and quality acceptance criteria. It’s an indispensable reference for ensuring that everyone on the team is aligned with the project scope and expectations.
It becomes the central database of project information when it is used and updated properly.
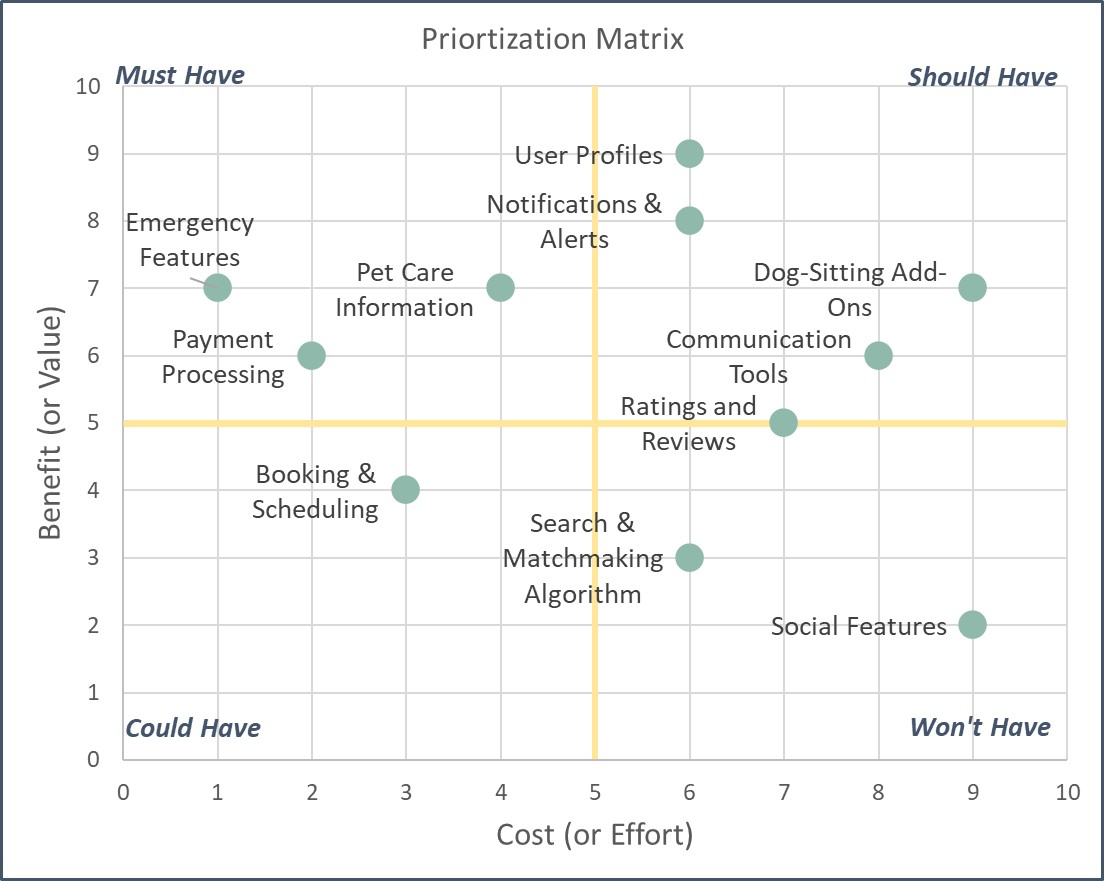
31. Prioritization Matrix (Value/Effort)
A simple yet powerful tool, the prioritization matrix helps the team rank features by cost and benefit on a scale of 1 to 10. It could also rank them by Value over Effort. Features with high benefits and low costs are tackled first, while high-cost, low-benefit features move to the bottom of the list. For example, user profiles might score high in benefit and low in cost, making them a priority.
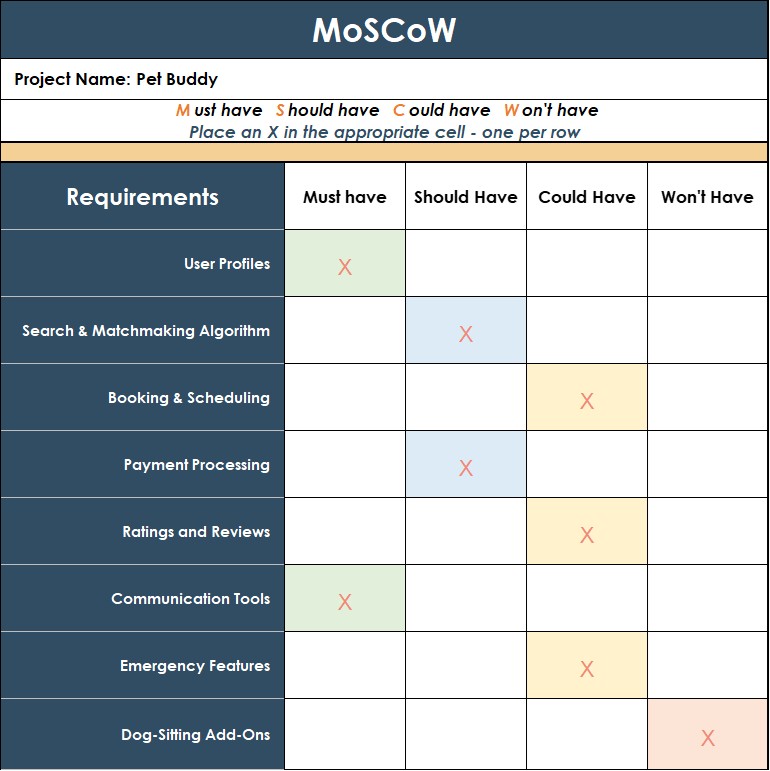
32. MoSCoW Method
MoSCoW stands for Must Have, Should Have, Could Have, and Won’t Have. The team sorts features into these categories to clarify priorities. Samantha works with stakeholders to decide that features like booking and scheduling are Must Haves, while dog-sitting add-ons might be Could Haves. To avoid endless must-haves (which happens in the real world), they can put a “work in progress” limit each for each category – five items for example.
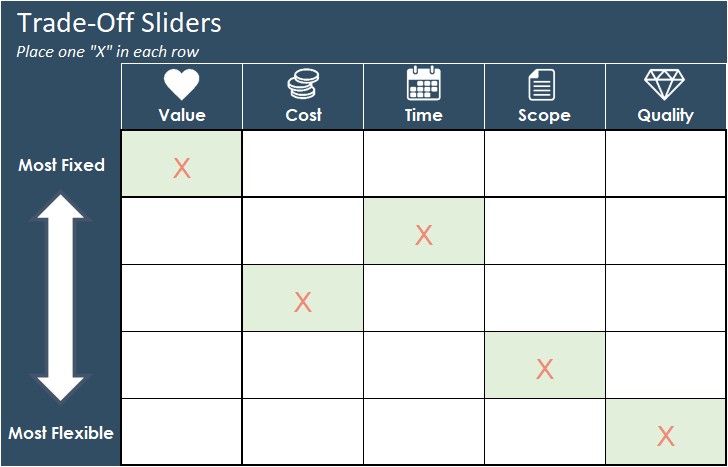
33. Trade-Off Sliders
The team uses trade-off sliders to decide what’s most fixed and most flexible on the project. For instance, they decide that meeting the project timeline is a must, while scope is flexible. This helps guide decisions when conflicts arise between features.
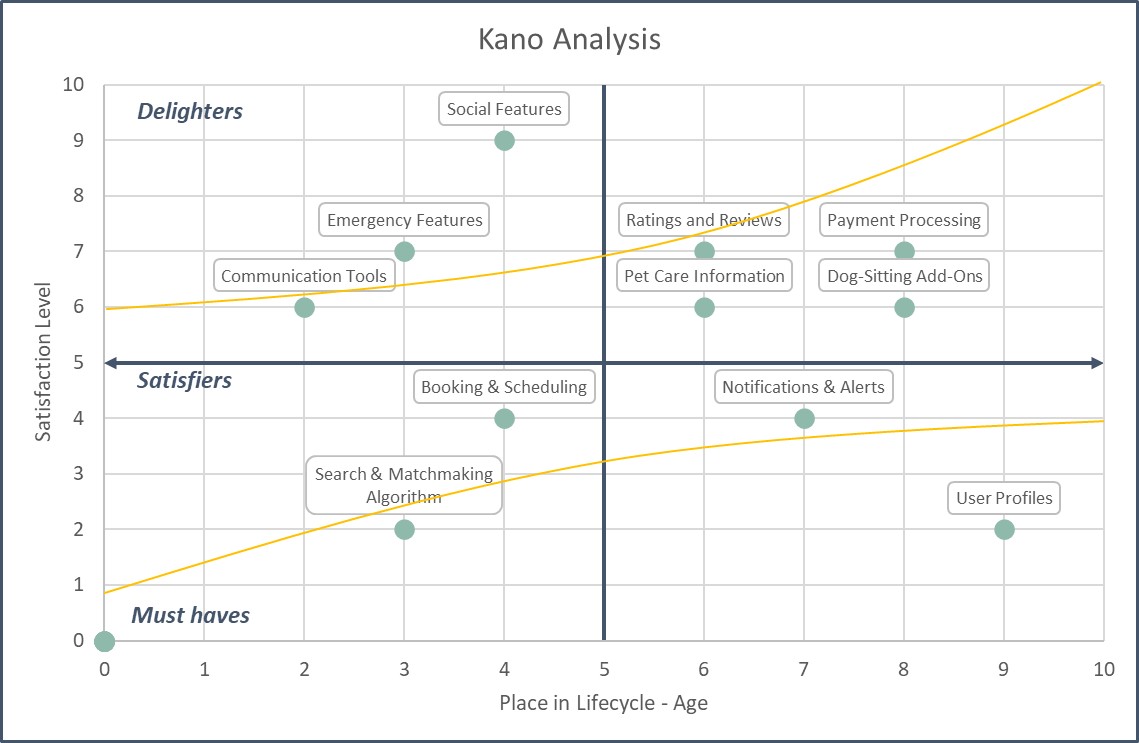
34. Kano Analysis
Kano analysis categorizes features as Must-Have, Satisfying, or Delighting. It’s based on Customer Satisfaction, but over the feature’s lifecycle. Electric Windows in your car were “Delighters” in the 80s and 90s, but over time have become “Must Have” features – we won’t even consider a car if it has manual winding windows.
In Pet Buddy for example, payment processing is a Must-Have, while social features might start as Delighters but eventually become standard expectations over time. This helps the team decide when to introduce specific features.
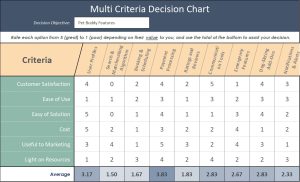
35. Multi-Criteria Decision Chart
When facing complex decisions with multiple stakeholders, the team uses this chart to rank features across various criteria that they decide upon (e.g., customer satisfaction, ease of development, marketing value). This is extremely useful when there are complex competing needs and stakeholders.
By averaging scores of the criteria they choose, they identify the highest-priority features, like payment processing, while deprioritizing lower-scoring items.
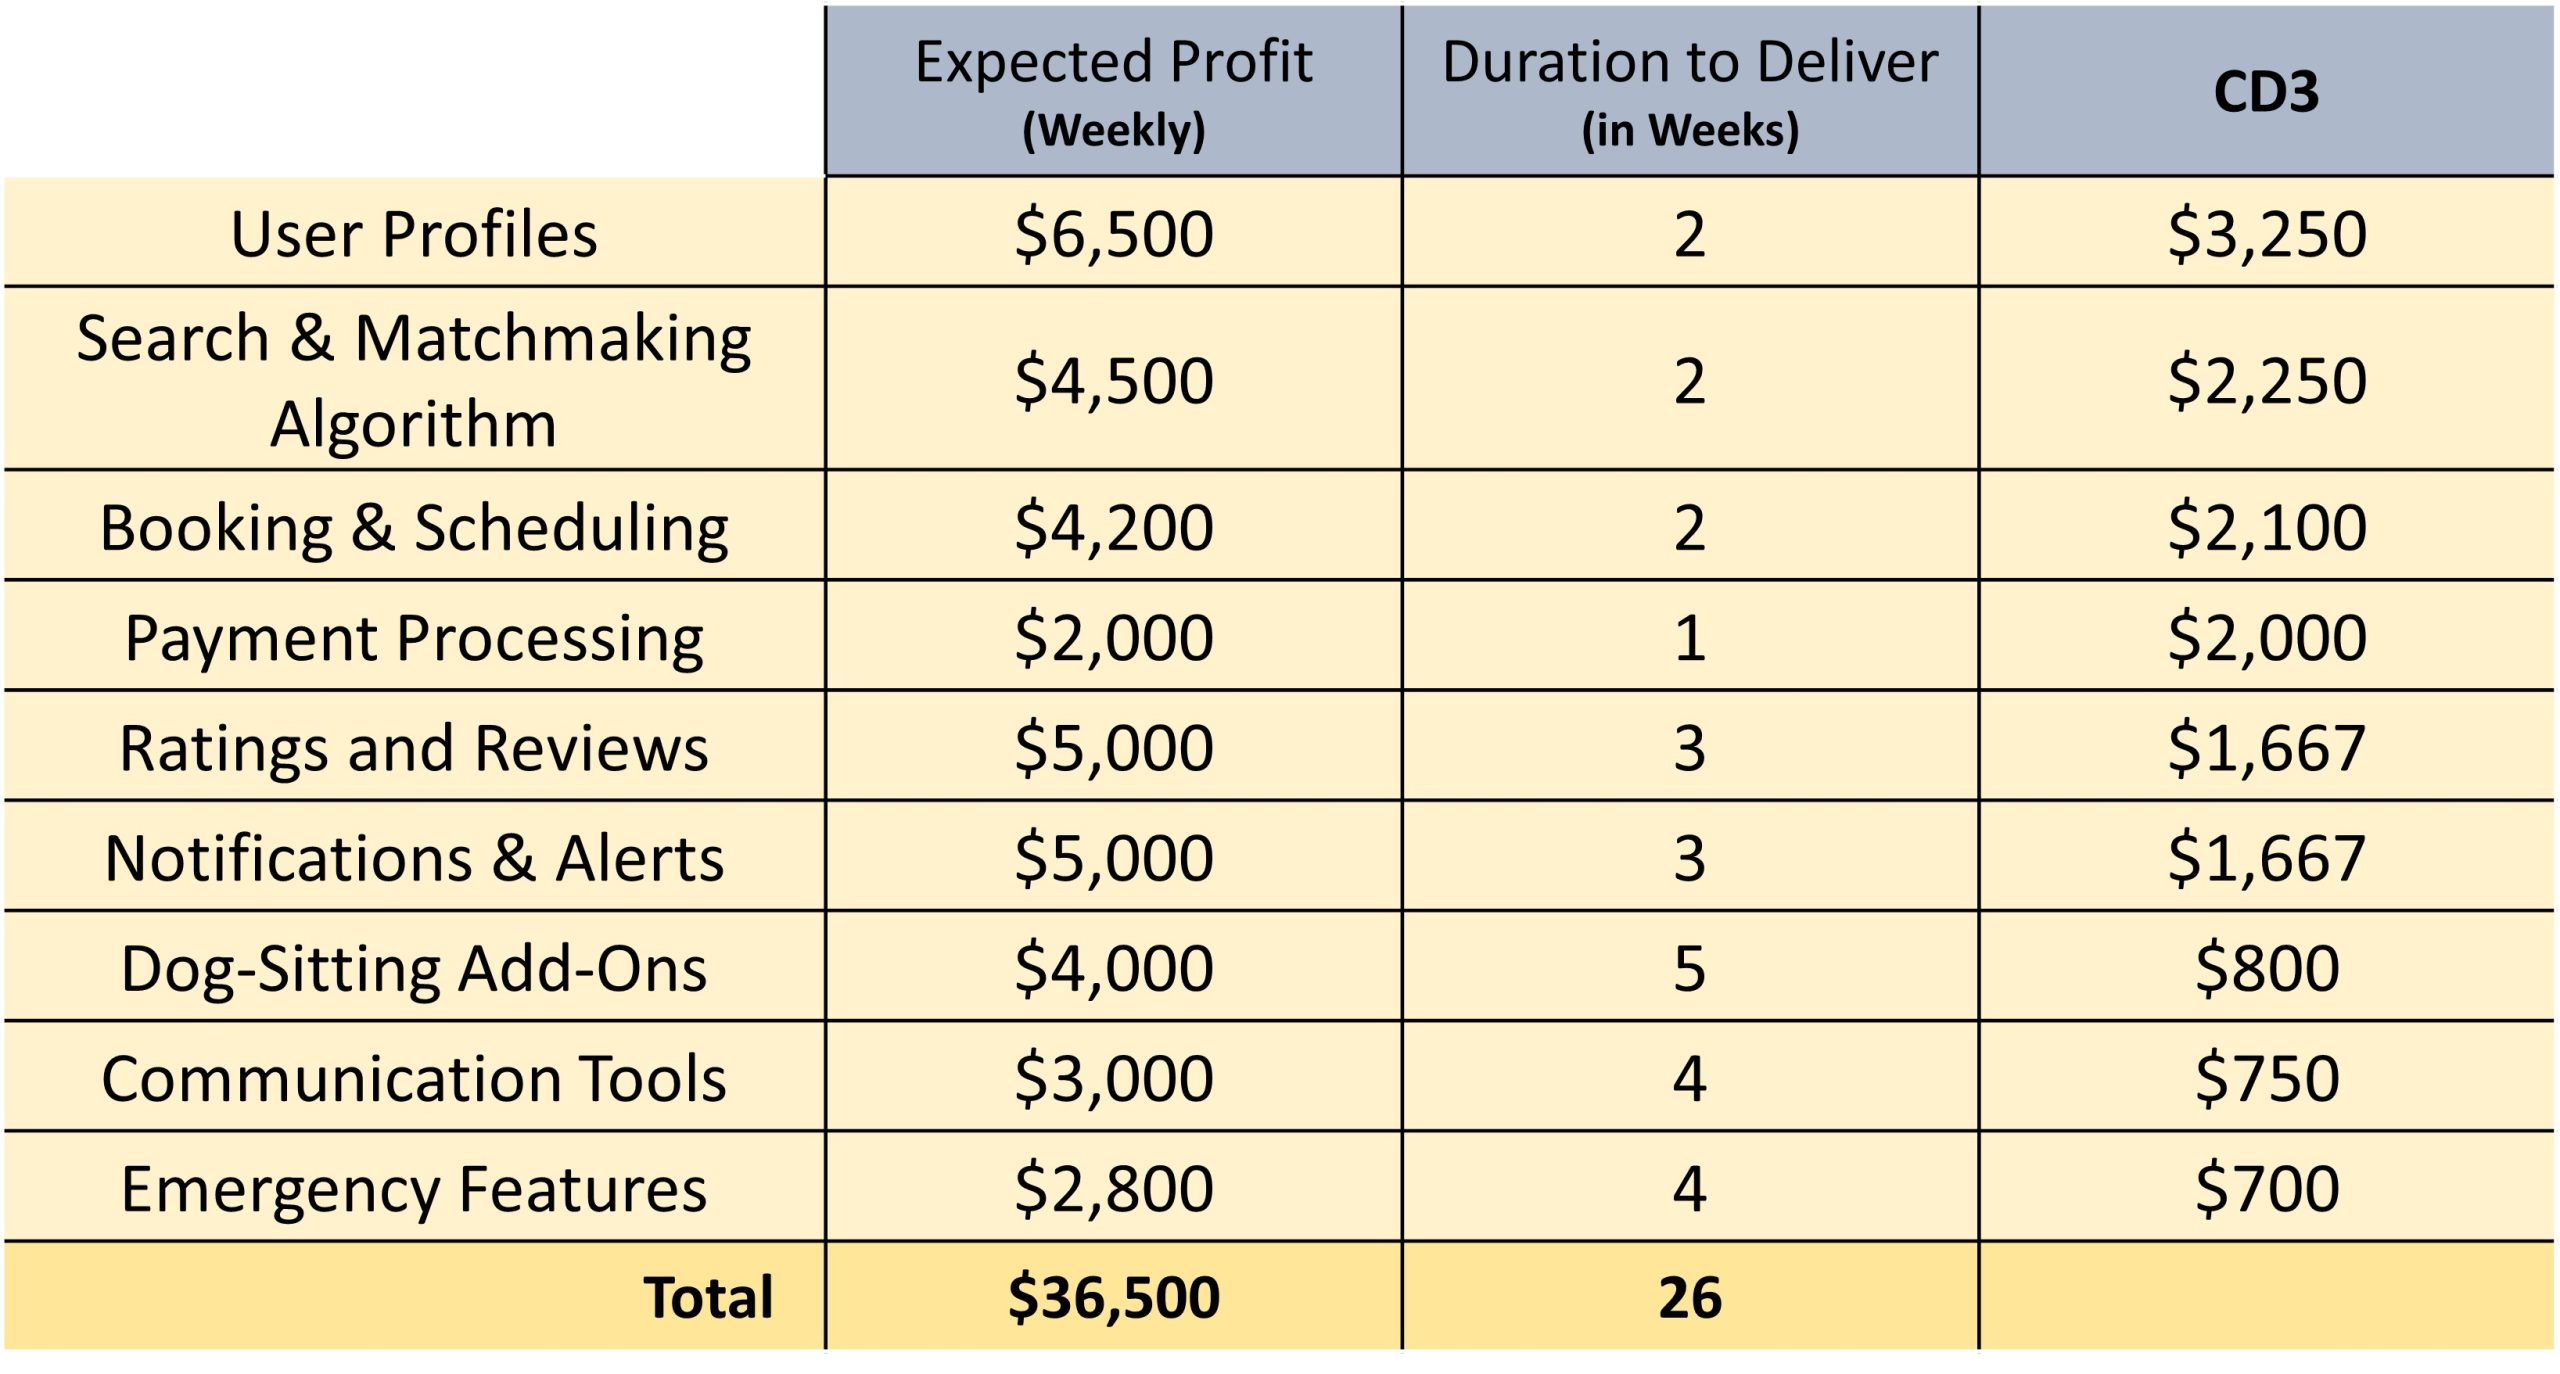
36. Cost of Delay
The cost of delay method estimates the weekly profit lost if a feature is delayed. For example, if user profiles would bring in $6,500 per week and take 2 weeks to build, the cost of delay is $3,250 per week – we divide the expected profit by the time it takes to deliver. Then we prioritize the highest to the lowest – the team uses this metric to prioritize high-value, fast-to-deliver features.
37. Multi-Voting
This simple yet powerful technique lets stakeholders vote on features using points, dots, or even Monopoly money. Each person distributes their votes across different features – they can spread votes evenly or place all of them on a single, high-priority item. The features with the most votes rise to the top of the list. It’s an effective, collaborative way to make collective decisions and balance competing priorities within the team.
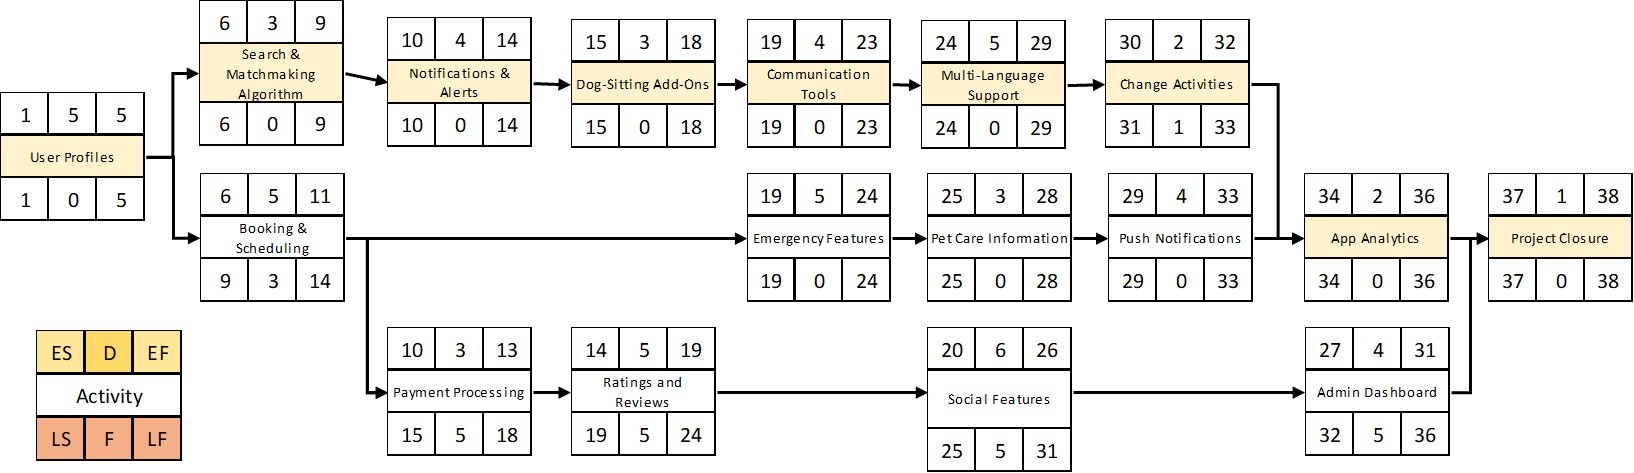
38. Schedule Network Diagram
A Schedule Network Diagram maps out the sequence of tasks in your project, showing the order in which activities need to be completed. For example, in our Pet Buddy project — an app that connects pet owners with sitters — we can list each feature and its estimated duration. By organizing tasks and estimating durations (e.g., 5 weeks for one feature, 3 weeks for another), we can identify the critical path — the sequence of tasks with zero slack. If any task on this path is delayed, the entire schedule shifts. This tool is invaluable for understanding task dependencies and pinpointing where delays might cause the biggest impact.
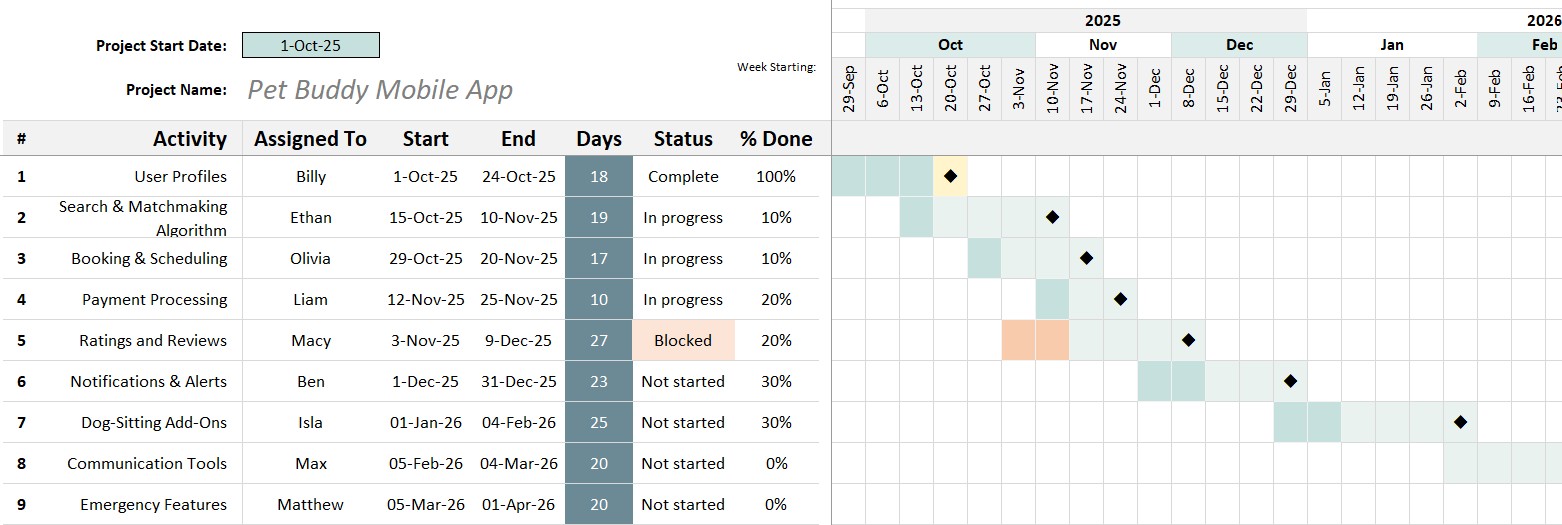
39. Gantt Chart
Gantt charts are one of the most common ways to visualize project schedules. They lay out tasks along a timeline, showing start and end dates for each item. Whether you’re planning weekly or daily, a Gantt chart provides a clear view of when specific tasks will be delivered. It’s a straightforward and powerful way to communicate your schedule to stakeholders.
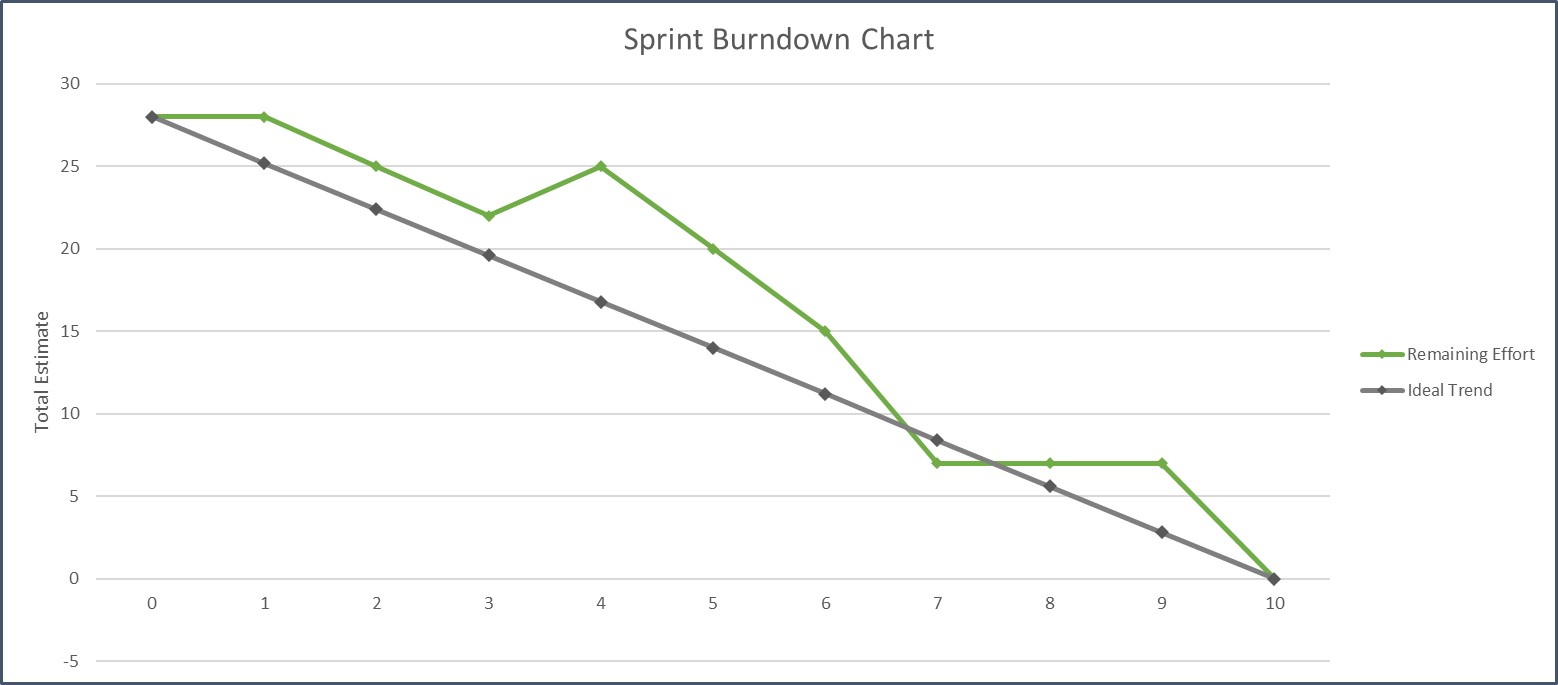
40. Sprint Burndown Chart
If you’re working in sprints, a Sprint Burndown Chart tracks how much work remains over time. Ideally, the chart trends steadily downward as tasks get completed. But if the line spikes up, it could indicate new tasks were added mid-sprint or some items took longer than estimated — as happened with the “dog sitter profiles” feature in our Pet Buddy example.
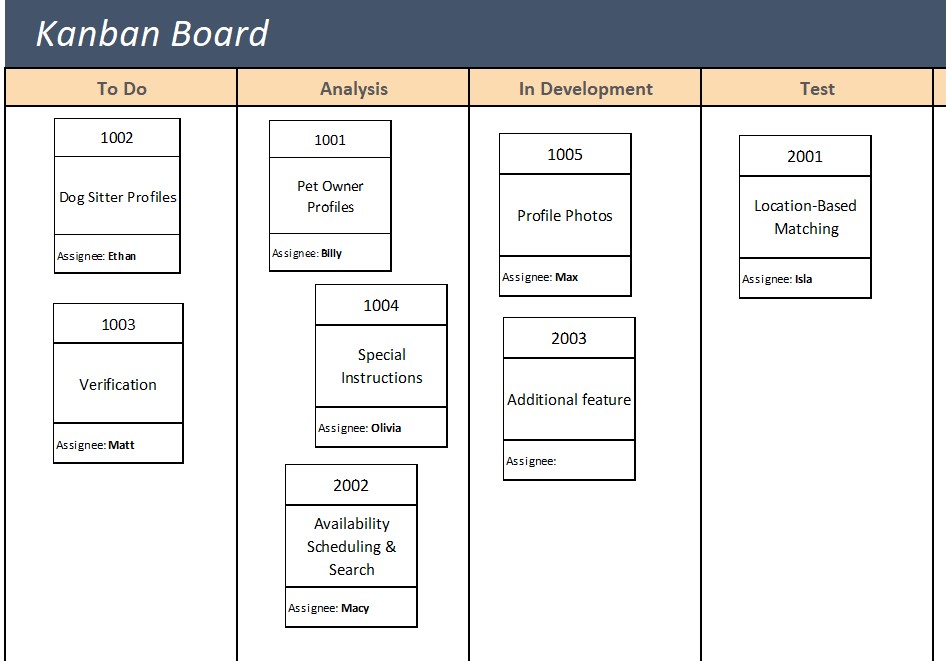
41. Kanban Board
For teams working in Agile or iterative environments, a Kanban board is a fantastic way to visualize work. Tasks move through stages like “In Development,” “Testing,” and “Done” as they progress. This tool is especially useful for sprint-based work, where teams complete batches of features in short cycles. Seeing tasks physically move through stages gives teams a real-time view of their progress.
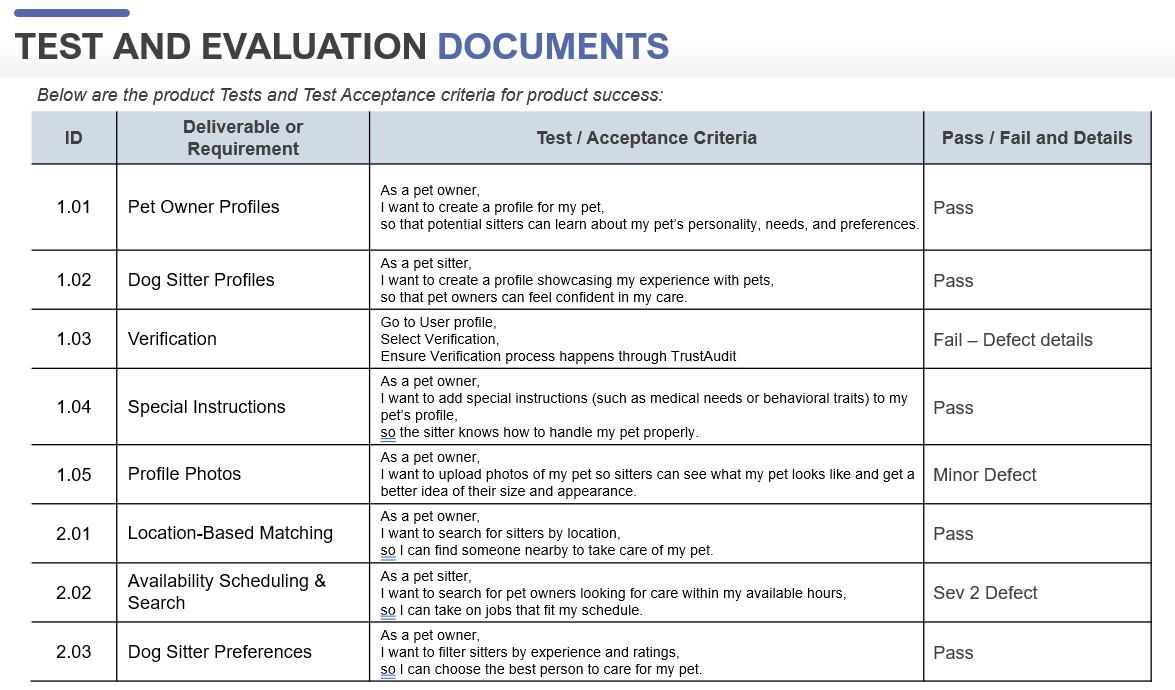
42. Test and Inspection Plan (Test & Evaluation Documents)
The first quality management tool in our toolkit is the Test and Inspection Plan. This tool outlines how testing will be conducted throughout the project, including acceptance criteria and the deliverables that need to be tested. In the Pet Buddy project, Macy, the test lead, and Jack, the tester, are responsible for creating these documents. The acceptance criteria define the steps needed for a deliverable to pass or fail the test.
Acceptance Criteria can be a series of steps to a requirement goal, or could be in the format of “Given, When, Then,” or “As a,” “I Want,” “So I can”.
43. Control Charts
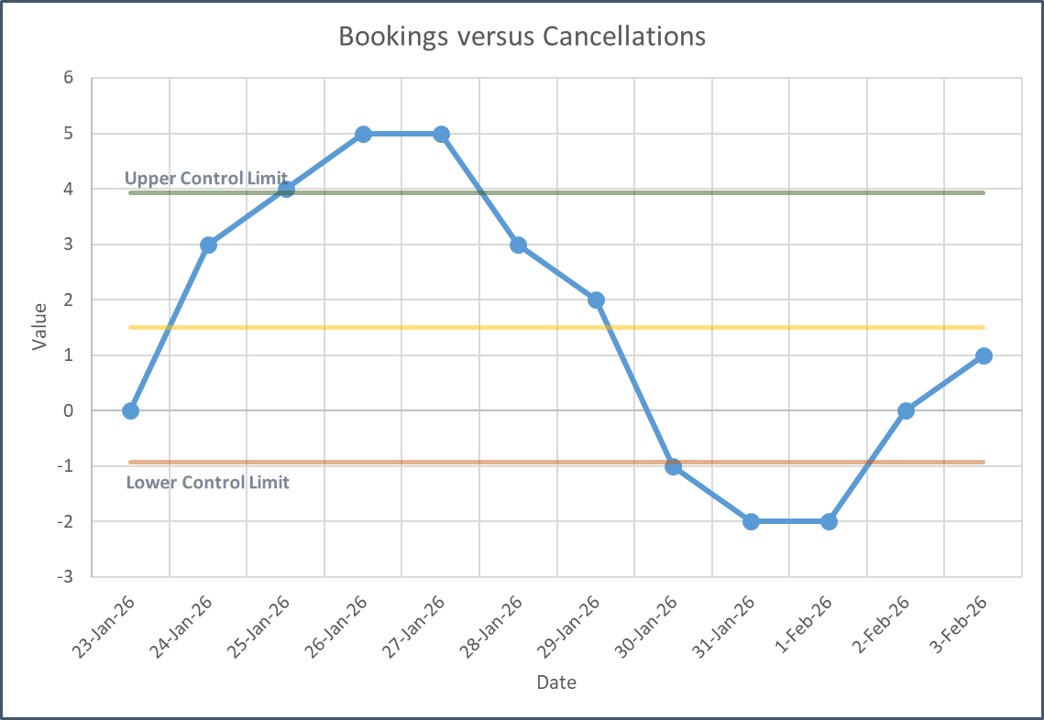
Once testing begins, monitoring the performance of processes is vital, which is where Control Charts come into play. In the Pet Buddy project, a control chart was used to track pet booking vs. cancellations. The chart visually displays data to determine if processes are within an acceptable range, showing whether bookings are performing as expected or if cancellations are becoming an issue.
The chart includes an average line and control limits—often set at three standard deviations from the average. However, in practical terms, the chart may be adjusted for more sensitivity to monitor performance more effectively. If the data points fall outside of the control limits, it’s time for a deeper investigation into the cause of the variations.
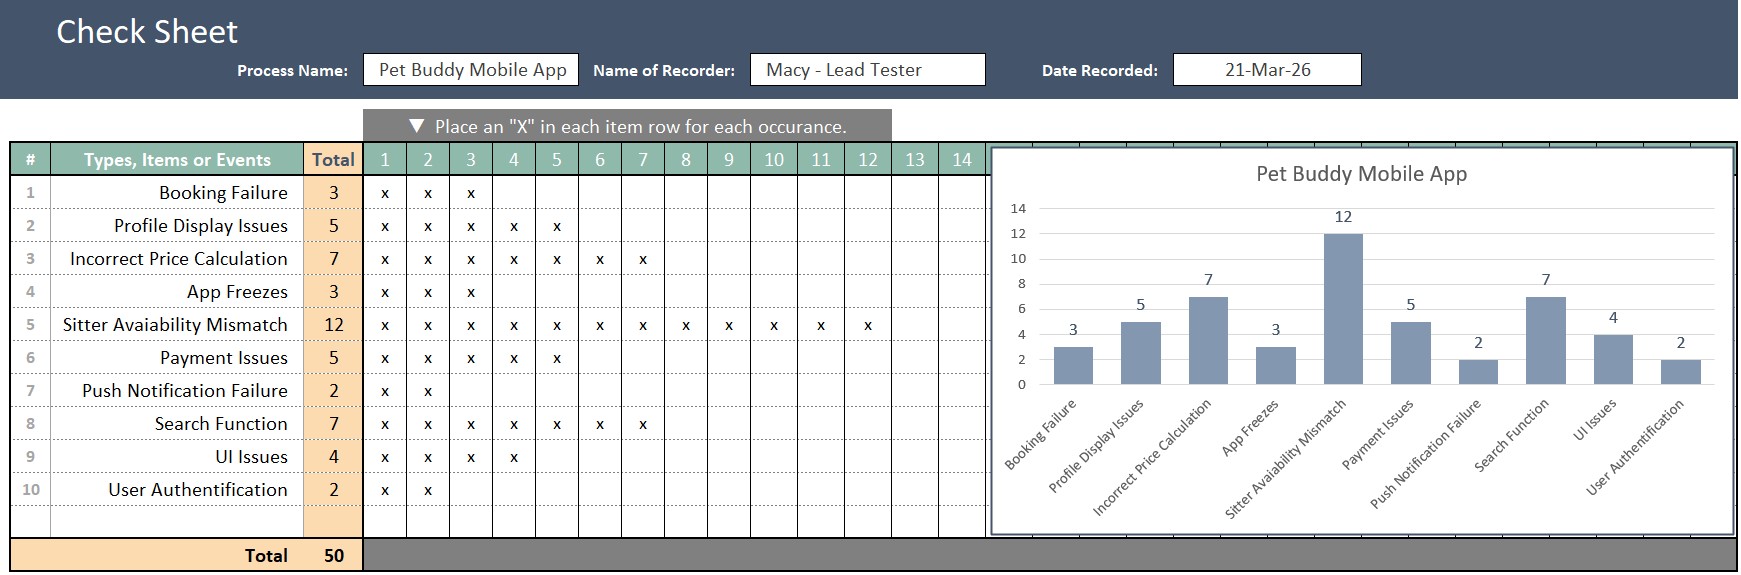
44. Check Sheets
When defects occur, tracking them efficiently is essential. Check Sheets provide a simple yet powerful way to collect and categorize defects. In Pet Buddy, Macy and Jack use a check sheet to record defects such as booking failures, app freezes, and display issues. By tallying the defects, the team can quickly identify patterns and prioritize actions based on the frequency and severity of the issues.
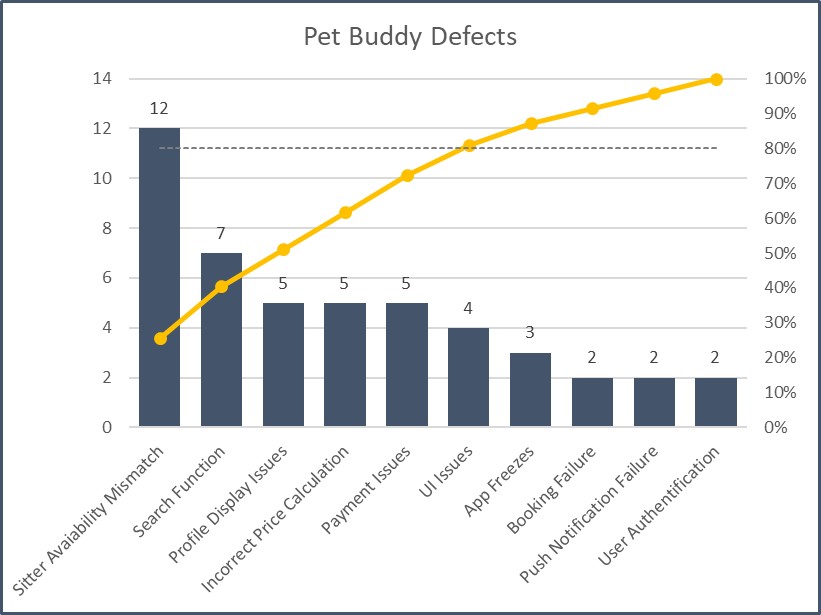
45. Pareto Charts
A more advanced version of the check sheet is the Pareto Chart. This tool takes the defects recorded in the check sheet and organizes them from largest to smallest, highlighting the most common or impactful problems. In the Pet Buddy example, the Pareto Chart showed that a sitter availability mismatch was the leading defect, causing the most significant number of issues.
This chart leverages the Pareto Principle, which states that 80% of the problems come from 20% of the causes. By focusing on the top 20% of defects, the team can address the core issues that will lead to the greatest improvements. The Pareto Chart gives the project team a clear focus, ensuring that efforts are concentrated on solving the most critical problems.
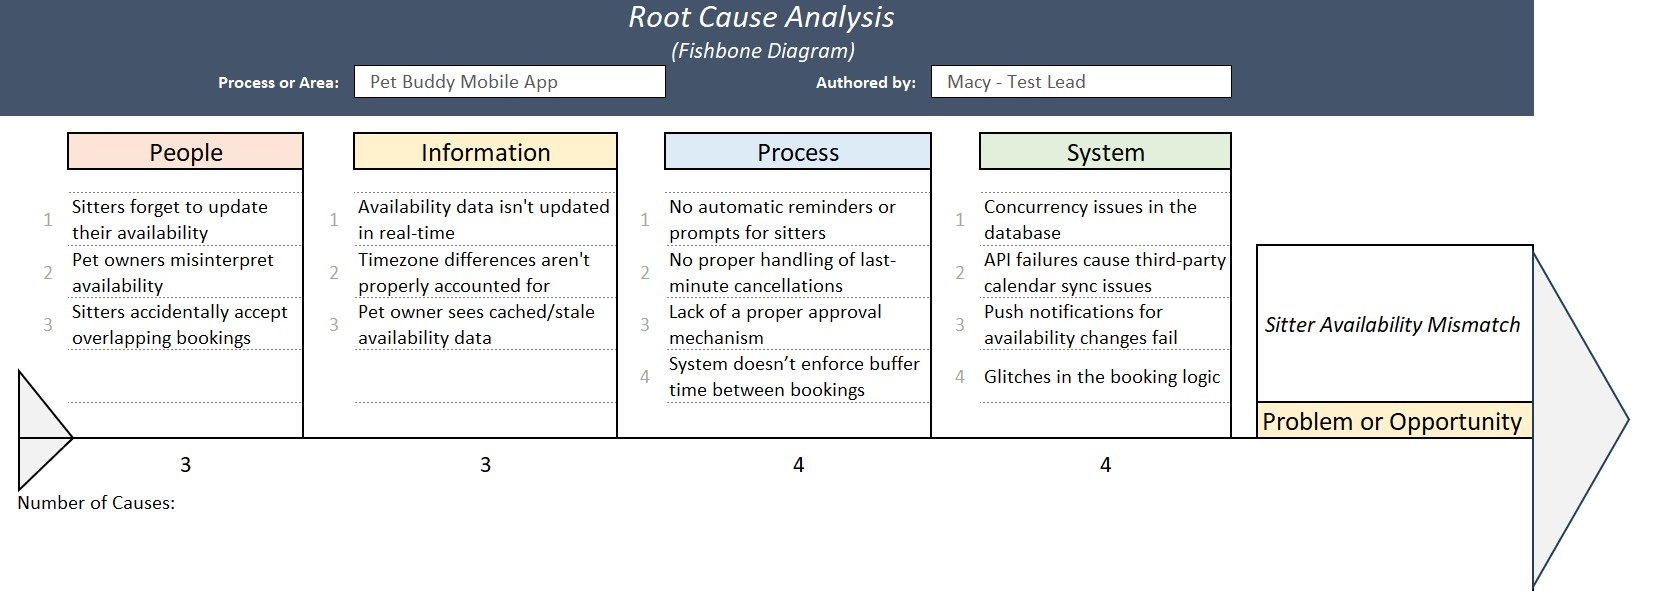
46. Ishikawa Diagram (Fishbone Diagram)
Once the team identifies the defects to work on, the next step is root cause analysis, and this is where the Ishikawa Diagram (also known as the Fishbone Diagram) comes into play. This tool helps in identifying the underlying causes of a problem by visualizing the various potential factors that contribute to it.
In the case of the sitter availability mismatch in the Pet Buddy project, the team uses the Ishikawa diagram to explore the different categories of potential causes: People, Information, Process, and System. This structured brainstorming approach uncovers the root causes of the problem, helping the team determine the most effective solutions.
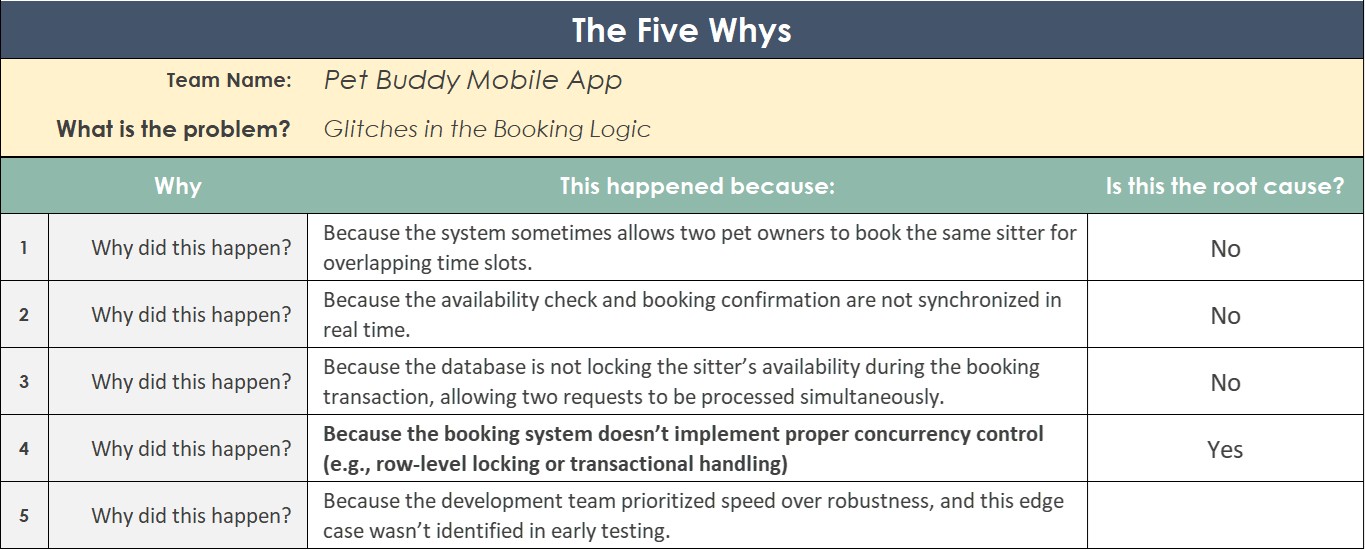
47. The Five Whys
An alternative method for root cause analysis is the Five Whys technique. This tool involves asking “why” repeatedly until the root cause is uncovered. For example, when analyzing glitches in the booking logic of the Pet Buddy app, the team might ask why the glitch is happening. The initial answer might be that the system allows two pet owners to book the same sitter at overlapping times. But by asking why further, the team uncovers that the true root cause is a lack of proper concurrency control in the booking system.
This iterative questioning helps dig deeper into the problem, ensuring that the actual cause is addressed, rather than just the symptoms.
48. Work Breakdown Structure (WBS) Dictionary with Cost Attributes
The first step in managing project costs is to clearly define the scope and the costs associated with each work item, with our Cost Estimates. The Work Breakdown Structure (WBS) Dictionary serves as a detailed record of the project’s scope, including estimates of the cost for each individual work item.
Additionally, these cost estimates can be enhanced by using commercial databases – resources that provide industry-standard pricing data for various project needs. These databases help refine cost estimates, making them more accurate and grounded in real-world pricing trends.
49. Bottom-Up Estimating
Once we’ve outlined the scope and cost estimates, the next step might include adding up those costs to an overall budget with Bottom-Up Estimating. This process involves calculating the cost of each small work package or task, then aggregating these costs to get the total cost of the project.
In Pet Buddy, the project manager would begin by estimating the cost of each individual feature (e.g., user registration, payment processing, pet sitter profiles). Afterward, these smaller costs are summed up to determine the overall budget for the app. This approach ensures that no detail is overlooked, and all costs are accounted for, resulting in a comprehensive budget estimate that reflects the entire project’s scope.
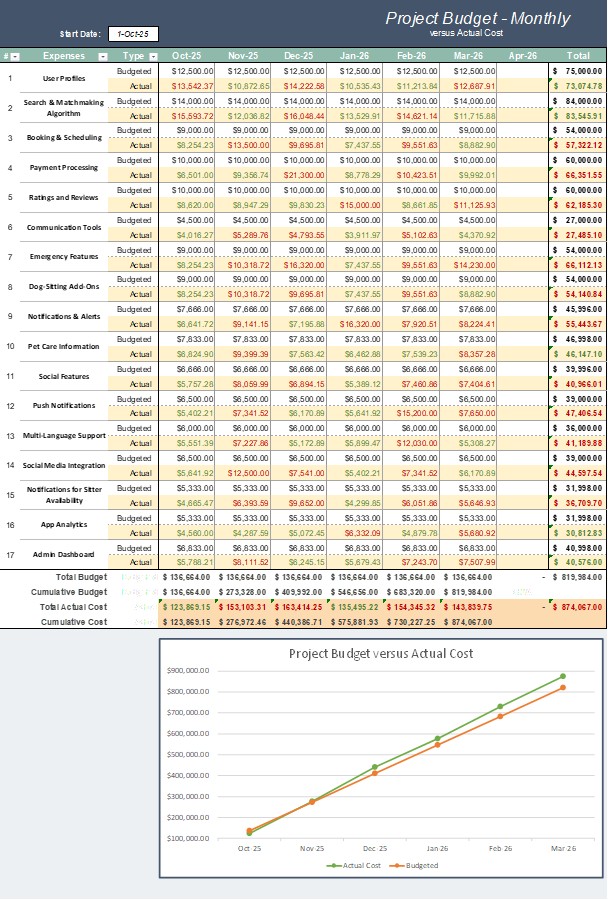
50. Project Budget (Planned vs. Actual)
With a detailed project budget in place, it’s essential to track the actual spending against the planned budget to ensure financial control. The Project Budget tool allows project managers to compare how much was originally budgeted for each aspect of the project versus what has been spent at any given point.
For Pet Buddy, a budget tracking system would automatically highlight where spending has exceeded the budget (marked in red) or come under budget (marked in green). This comparison allows the team to take corrective actions if certain features are running over budget, ensuring the project remains financially on track.
A Budget Trend Chart can visually display this data, helping project managers track financial performance over time. By comparing the actual cost (green) to the planned value (orange), project managers can quickly see if the project is on target, ahead, or behind financially, allowing for timely decision-making and adjustments.
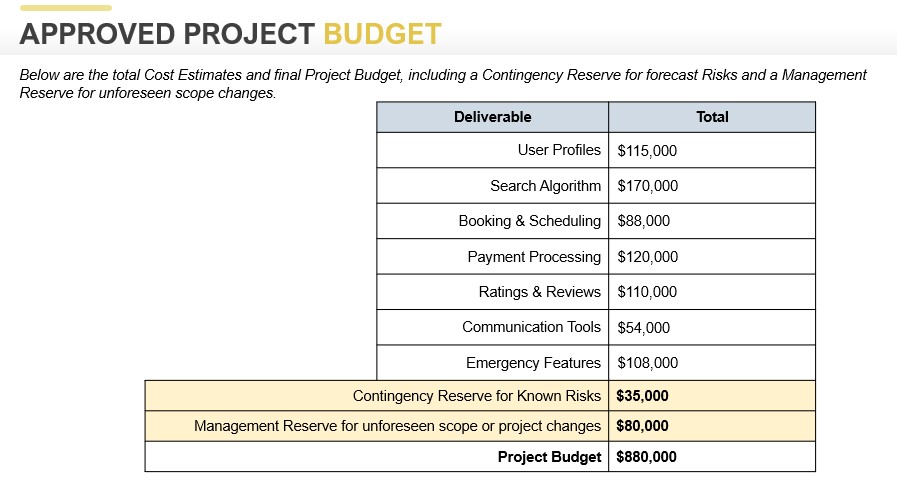
51. Contingency and Management Reserves
Despite thorough planning and estimating, unforeseen issues can still arise, which is why Contingency Reserves and Management Reserves are crucial components of a project’s financial plan.
Contingency Reserves are funds set aside to deal with known risks or issues that are anticipated during the project. For instance, if there are potential delays in the app’s development due to vendor issues, a contingency reserve might be used to cover these additional costs. In the Pet Buddy project, the team has allocated $35,000 for such known risks.
Management Reserves, on the other hand, are intended for unforeseen changes to the project scope, such as adding new features or responding to changes in market conditions. Pet Buddy has set aside $80,000 for these types of unexpected changes.
It’s important to note that these reserves are not automatically spent but are accessed only when necessary and with approval from the appropriate stakeholders.
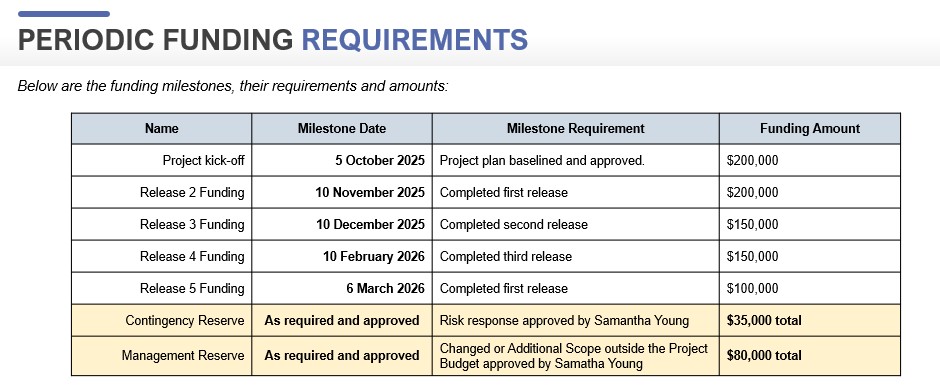
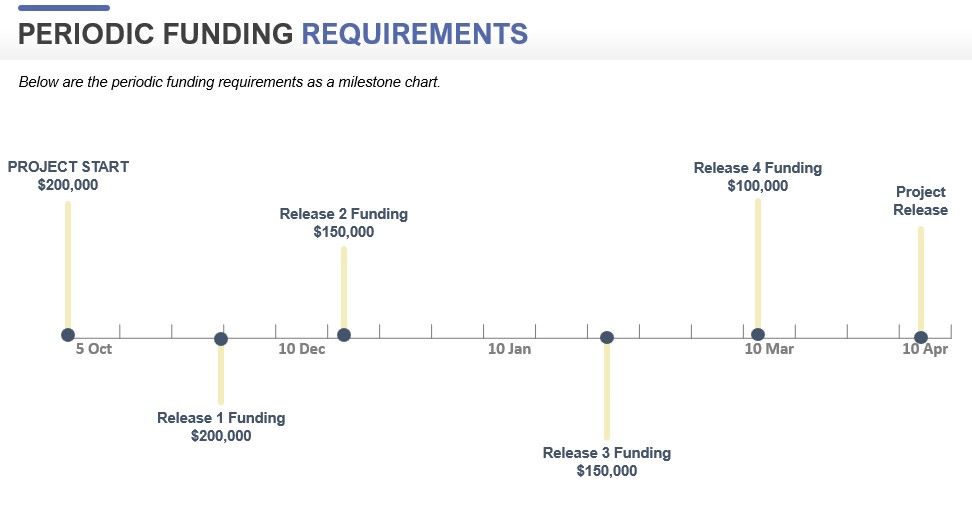
52. Periodic Funding Requirements and Milestones
Managing cash flow is critical in any project, and Periodic Funding Requirements ensure that the project has the necessary funding at each phase. For Pet Buddy, this means releasing funds at different milestones based on project progress.
The funding structure starts with an initial release of $200,000 to kickstart the project. As the app development progresses and key deliverables are completed, subsequent funding releases are made, contingent on meeting certain milestones. If the project progresses as planned, funding will be released according to the schedule, supporting the continued work on the app. If not, there may be delays or cutoffs in funding, which is why consistent progress is crucial to ensure the project remains financially viable.
A Milestone Chart visually maps out the project’s funding requirements at each phase, from initial development through to completion. It ensures that the team has the necessary resources at every stage of the project, while also providing stakeholders with clear visibility into the project’s financial health.
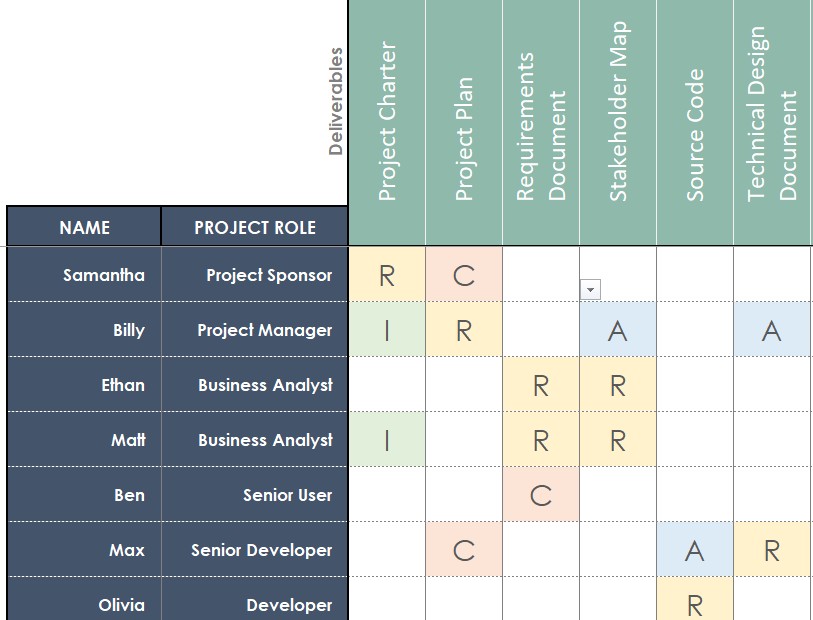
53. RACI Chart: Clarifying Roles and Responsibilities
One of the first steps in managing resources is ensuring clarity around roles and responsibilities. The RACI chart (Responsible, Accountable, Consulted, Informed) is an essential tool in this regard. By creating a RACI chart, the project manager, Billy, can ensure that everyone on the team knows exactly what is expected of them.
For the Pet Buddy project, Billy works with the team to assign clear roles for every task. For example:
Responsible: Developers Max, Olivia, Liam, and Isa are responsible for the source code.
Accountable: Max, the senior developer, is accountable for overseeing the source code and ensuring it meets the required quality standards.
Consulted: Senior User, Ben, provides expert judgment on project deliverables.
Informed: The project sponsor, Samantha, is kept informed about progress through regular project status reports.
The RACI chart is an effective way to make sure that tasks are not duplicated or overlooked, providing the clarity needed for the team to move forward.
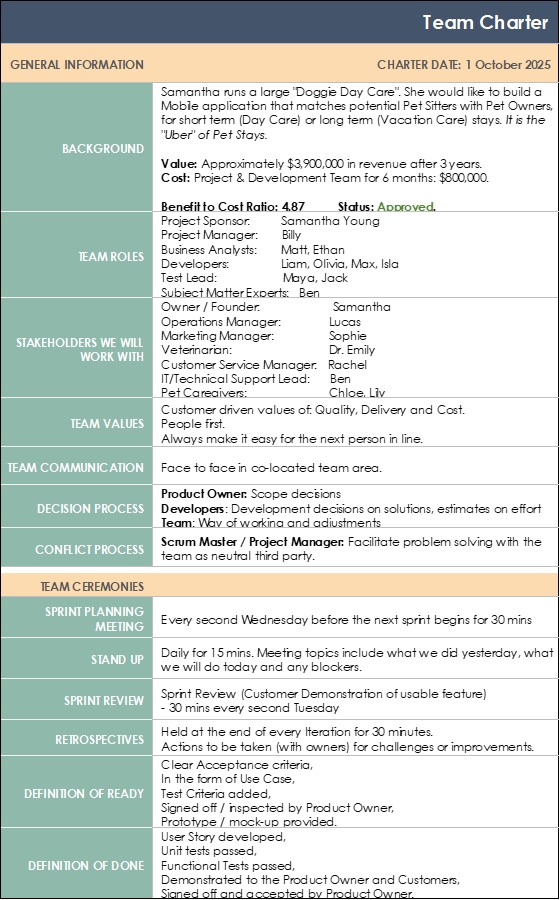
54. Team Charter: Defining the Mission and Values
Once everyone knows their roles, the next step is to create a Team Charter, a document that outlines the mission, values, ways of working, and team expectations. For the Pet Buddy project, the charter clarifies why the project exists (to create an app for connecting pet sitters and pet owners) and sets the team up for success by defining how they will work together.
The Team Charter covers:
Project background: The need for the mobile app that facilitates pet stays.
Team roles and stakeholders: Clear identification of project sponsors, managers, analysts, developers, testers, etc.
Ways of working: Values like punctuality, availability, and commitment to collaboration.
Communication plans: Setting expectations for how the team will stay connected, whether through in-person meetings or communication platforms like messaging software or video calls.
Decision processes: Who makes the final decisions on scope changes, work adjustments, and estimates?
Having a Team Charter helps create a shared understanding of expectations and improves team cohesion, ensuring that everyone is on the same page from day one.
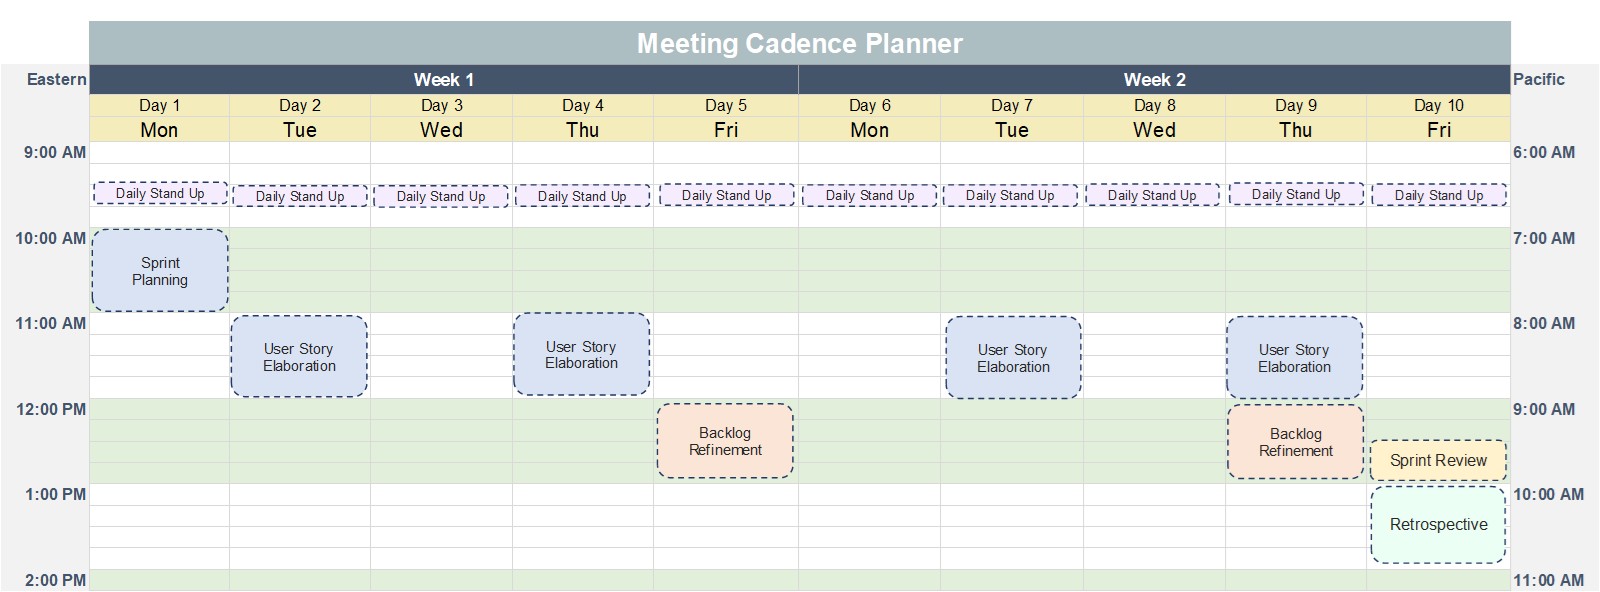
Meetings are an essential part of any project, but the key to successful collaboration is having the right number of meetings at the right times. Billy, the project manager, uses a Meeting Cadence Planner to ensure that the team meets as needed, but without overwhelming them with unnecessary discussions.
For the Pet Buddy project, the meeting cadence includes:
Daily stand-ups: A short daily check-in meeting where everyone shares what they worked on yesterday and what they plan to work on today.
User story elaboration sessions: Twice a week, the team comes together to clarify acceptance criteria and refine user stories.
Ad-hoc meetings: When necessary, the team gathers to resolve specific issues or make key decisions.
By using the Meeting Cadence Planner, Billy can keep the team focused on work while ensuring they have enough opportunities for collaboration, feedback, and decision-making.
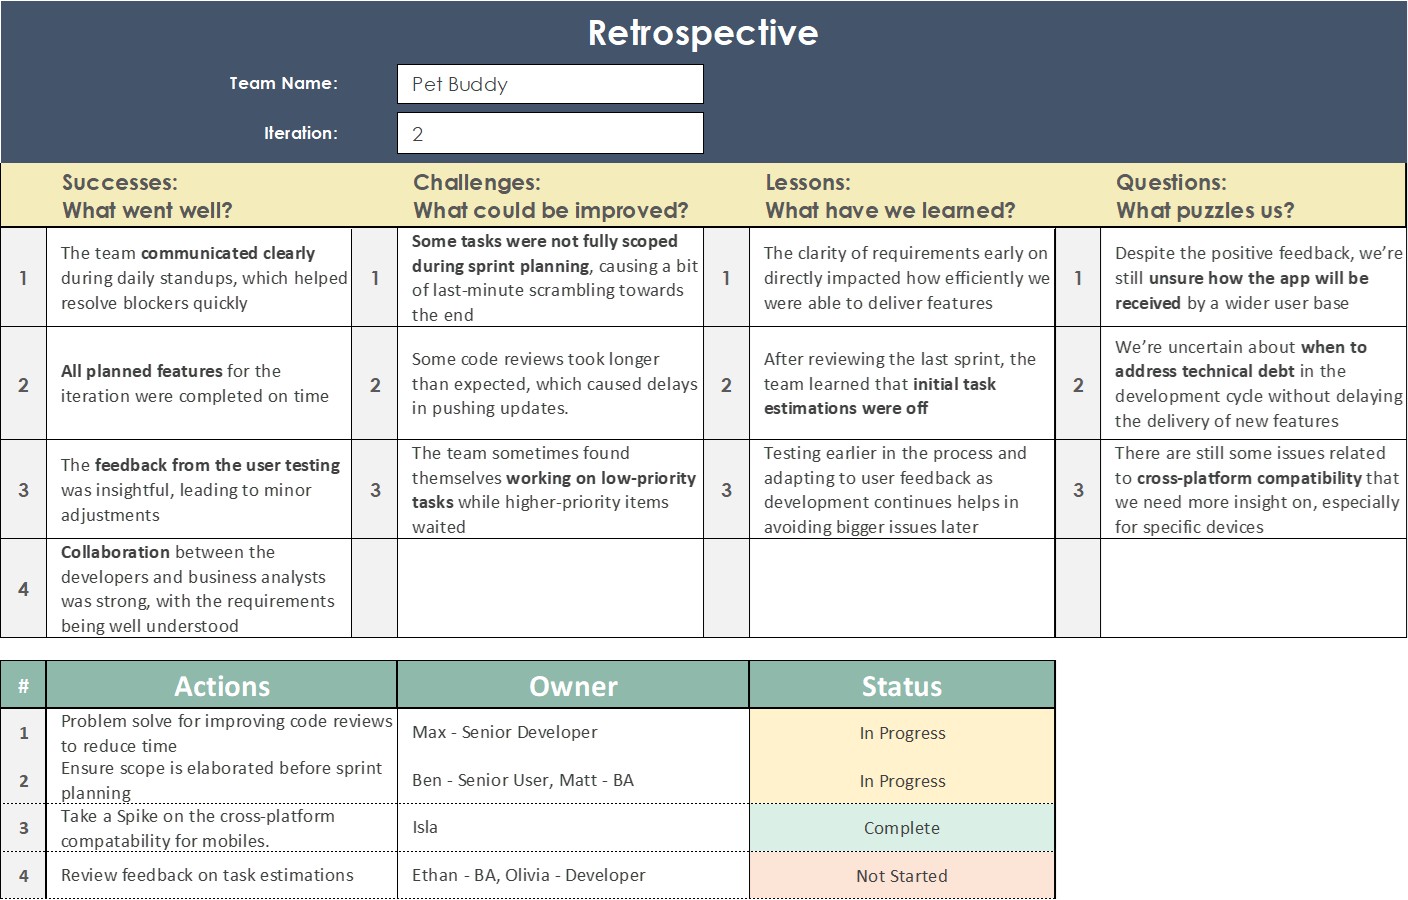
56. Retrospective: Continuous Improvement
In any project, there’s always room for improvement. After every sprint or iteration (typically every two weeks), the team holds a Retrospective. This agile practice allows the team to reflect on what went well, what challenges arose, and what lessons can be learned.
The retrospective for the Pet Buddy project might cover:
What went well: Perhaps the team communicated effectively, or maybe the development was faster than expected.
Challenges: Maybe some items weren’t fully elaborated, leading to misunderstandings and delays.
Lessons learned: Initial task estimations could be more accurate in the future.
What still puzzles us: Any questions we need answered.
We should also have actions for improvement: Adjusting estimations, refining the scope definition, or improving communication.
This continuous feedback loop helps the team improve their processes and become more efficient over time, making them a high-performing group.
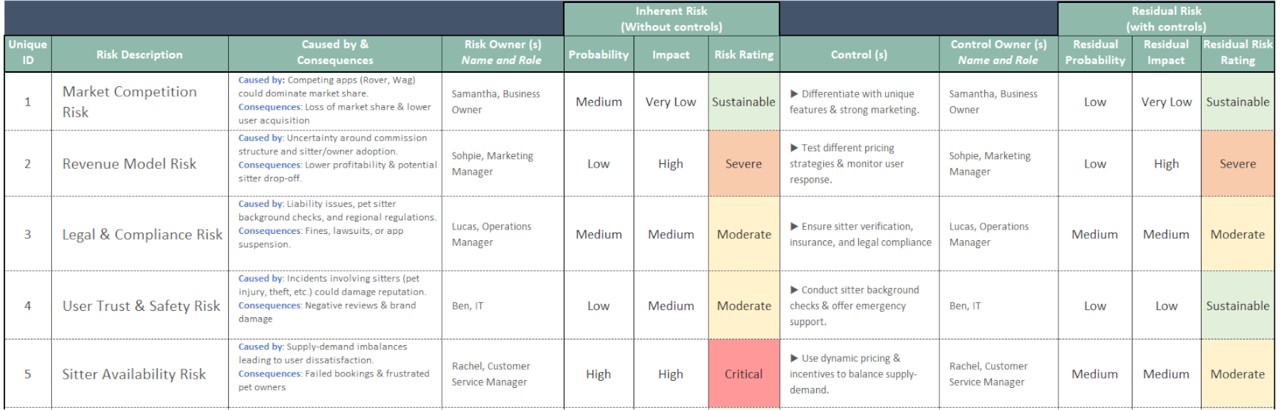
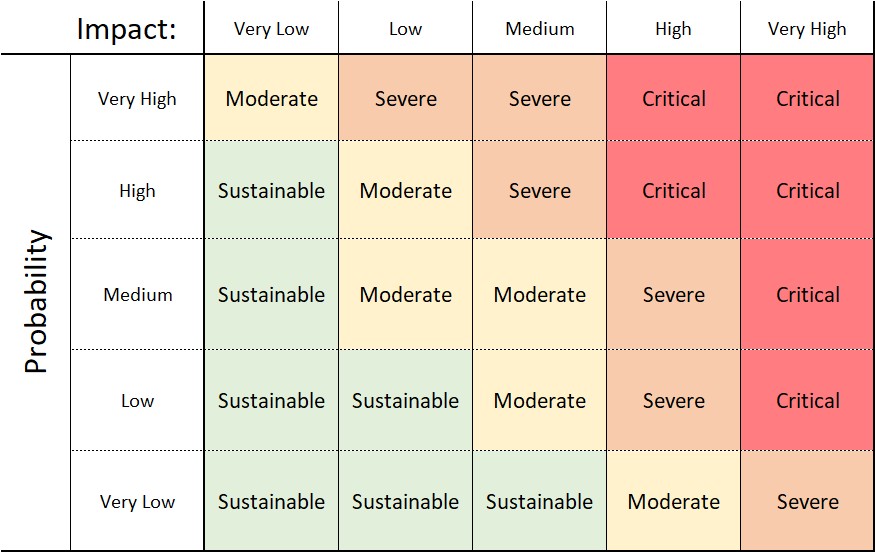
57. Risk Assessment Matrix
The Risk Assessment Matrix is an essential tool for identifying and evaluating risks based on their probability and impact. It helps project teams to prioritize risks and decide on appropriate actions for risk mitigation. By rating risks from low to high, teams can calculate a risk score by multiplying the likelihood of a risk occurring with its potential impact. This process highlights critical risks that require immediate attention and control measures, allowing teams to focus their efforts where it matters most. Once mitigation actions are applied, the risk levels can be re-assessed and brought under control, reducing their potential impact on the project.
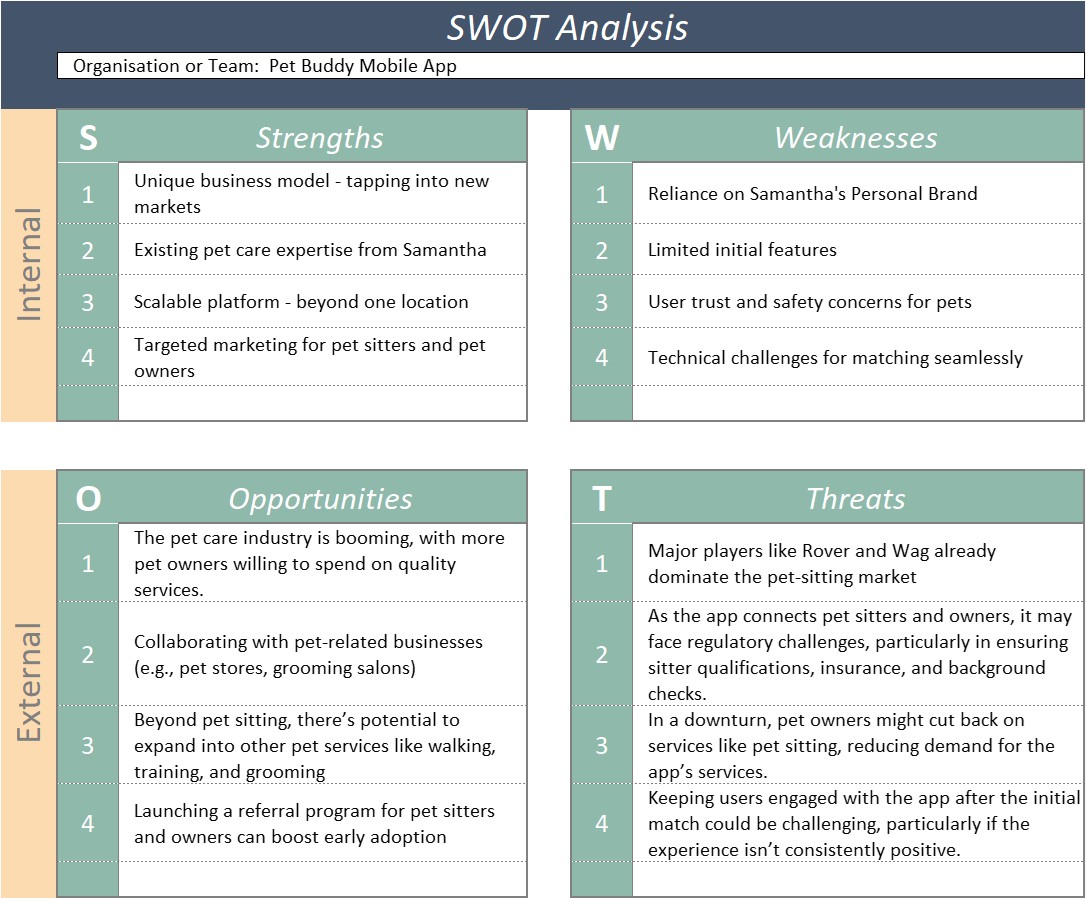
58. SWOT Analysis
A SWOT analysis (Strengths, Weaknesses, Opportunities, and Threats) is an excellent brainstorming tool for identifying risks. In the context of risk management, weaknesses represent internal risks within the project, and threats refer to external factors that could pose risks. For example, if a project depends heavily on the business owner’s brand, this could be considered a weakness. External threats could include competitor dominance in the market or economic downturns affecting consumer spending. The SWOT analysis helps teams analyze internal and external factors that could affect the project’s success and create proactive strategies to manage those risks.
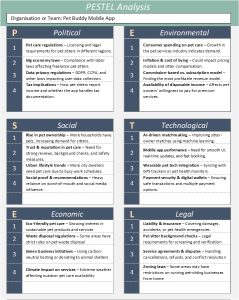
59. PESTEL Analysis
Similar to SWOT, the PESTEL (Political, Economic, Social, Technological, Environmental, and Legal) analysis helps project managers assess external risks. This analysis provides a broader view of potential risks that could affect a project, such as changes in laws, political instability, or technological advancements. For instance, if a new AI-driven technology emerges, it could represent both an opportunity and a risk for a mobile app project like Pet Buddy. Identifying these risks early on can allow teams to take advantage of opportunities while mitigating threats before they materialize.
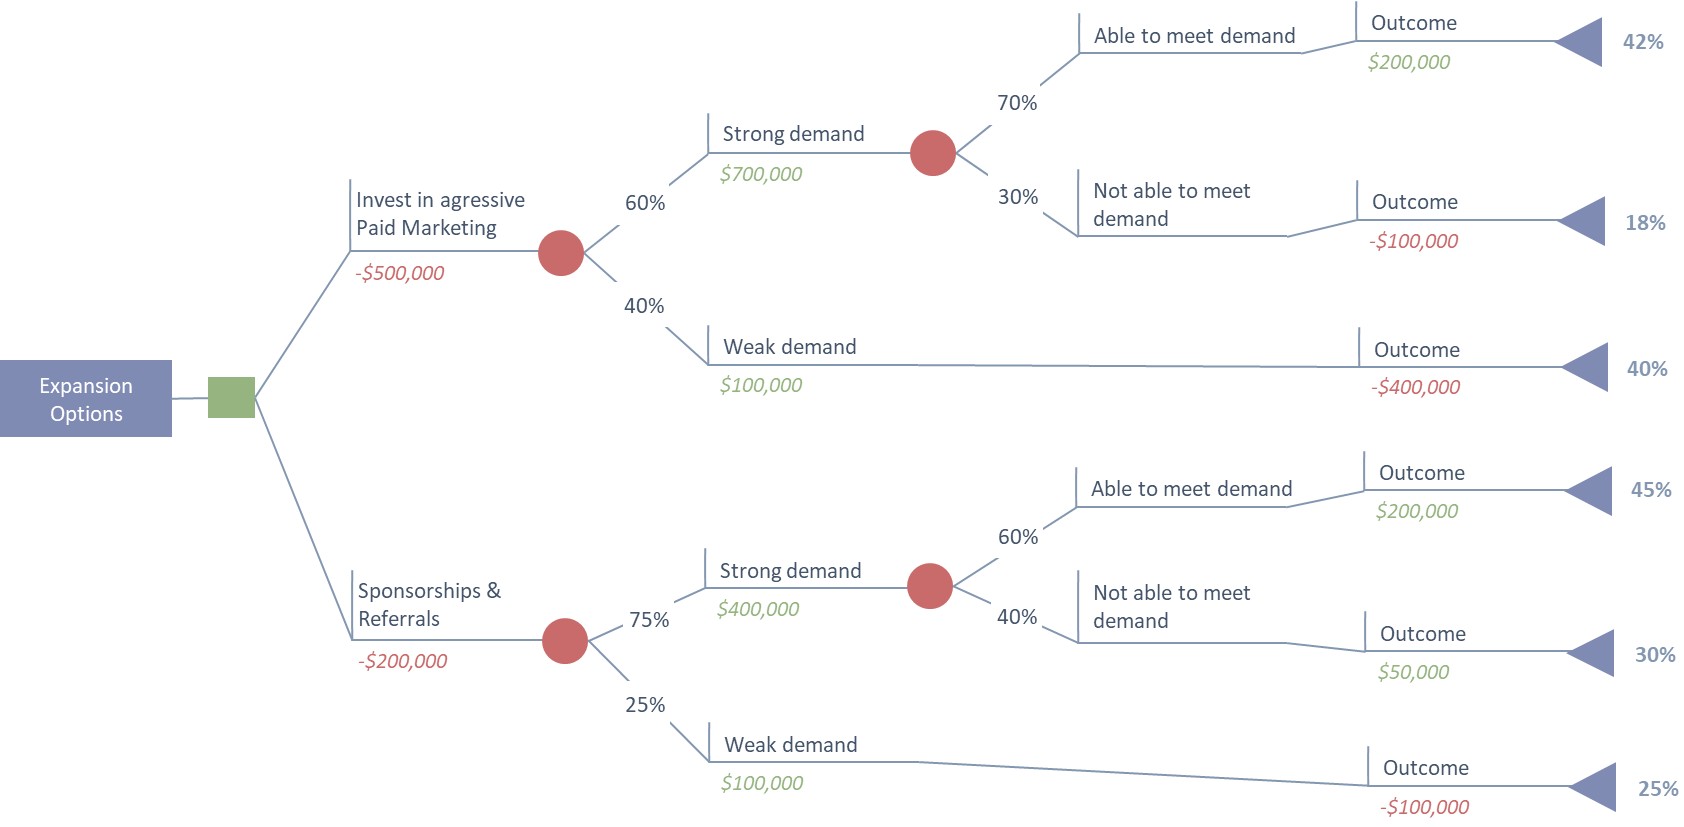
60. Decision Tree Analysis
Once risks are identified, it’s time to explore quantitative measures to understand the costs and benefits of various decisions. A decision tree analysis is a powerful tool for visualizing different decision paths, outcomes, and probabilities. By assessing various decision scenarios—such as choosing between two marketing strategies—project managers can determine the most cost-effective and impactful decision. For example, aggressive paid marketing may have a 60% chance of success, but a sponsorship approach might yield better returns with a higher probability. This tool helps project managers make data-driven decisions that optimize project outcomes while mitigating risks.
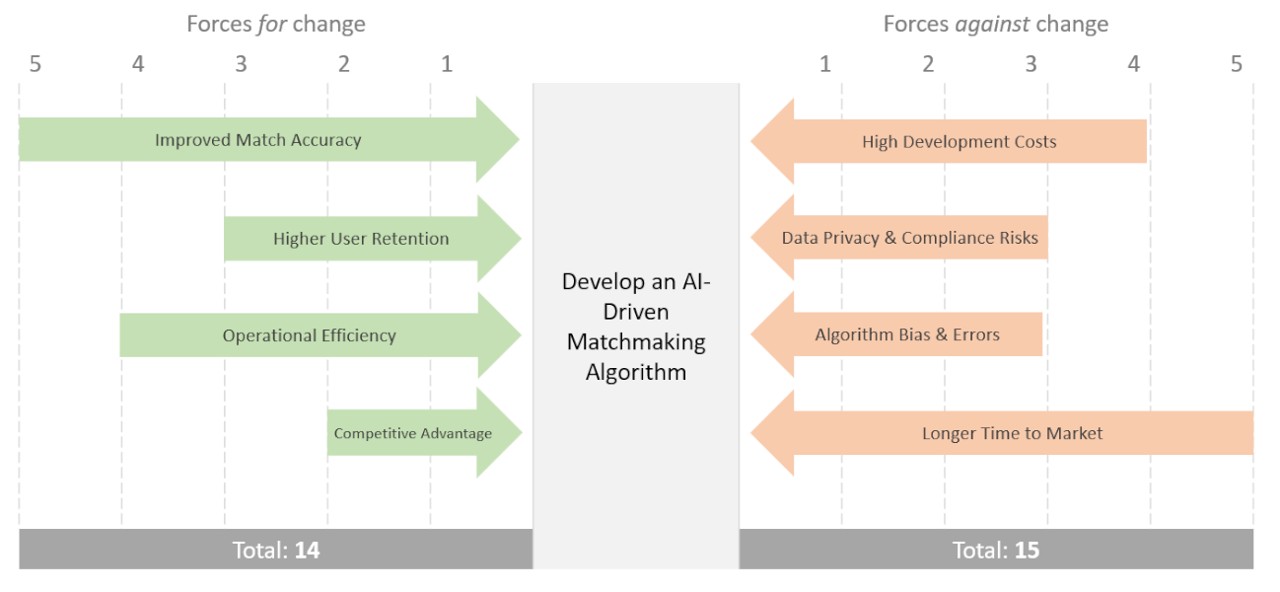
61. Force Field Analysis
Force Field Analysis is another technique used to assess the driving and restraining forces for a particular decision or change within a project. In risk management, it helps teams evaluate the pros and cons of a potential risk or opportunity. For example, when considering the development of an AI-driven matchmaking algorithm for the Pet Buddy app, the driving forces may include technological innovation and market demand, while the restraining forces might involve high development costs and potential algorithmic errors. By ranking these forces on a scale of 1 to 5, teams can assess whether the potential benefits outweigh the risks and make an informed decision.
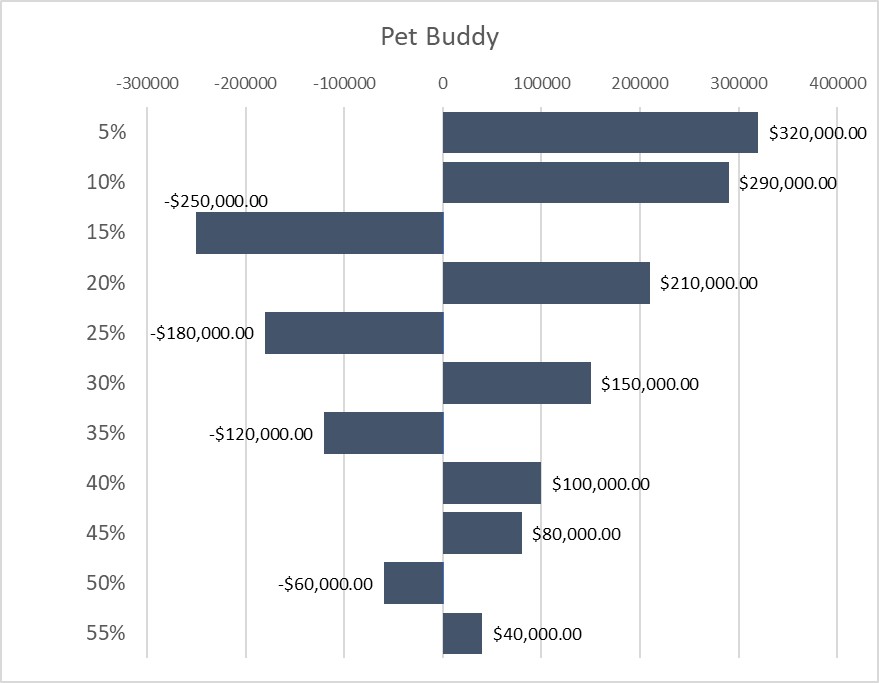
62. Sensitivity Analysis (Tornado Chart)
The Sensitivity Analysis, often depicted as a Tornado Chart, is used to evaluate how sensitive a project is to certain variables. For example, the Pet Buddy project could look at how changes in the commission rate for pet sitters affect overall revenue. By adjusting different variables (such as the percentage of commission), a project manager can visualize the positive and negative impacts on revenue. This analysis allows teams to identify which factors are most critical to the project’s success and prioritize actions that will minimize risks associated with those factors.
Conclusion
And that wraps up our deep dive into the 63 essential project management tools from the PMBOK Guide. By now, you should have a solid understanding of how these tools can be applied throughout the entire project lifecycle, from initiation all the way to the final delivery. Whether you’re working on a project like Pet Buddy or managing any other initiative, these tools are invaluable for ensuring your project stays on track, meets its objectives, and is successful.
Remember, mastering these tools isn’t just about passing your PMP Exam — it’s about becoming a more effective and efficient project manager. The skills and techniques you’ve learned here will help you tackle real-world challenges, manage stakeholders, control scope, mitigate risks, and deliver quality results.
Keep practicing, keep learning, and you’ll be well on your way to achieving success in your projects and your career. You can do this! I believe in you.
Effective Risk Management Tools for Successful Project Outcomes
In the world of project management, risk is an inevitable factor that can significantly impact project success. Effective risk management is crucial in navigating these uncertainties. In this article, we explore six powerful tools and techniques that every project manager should consider when addressing risk. These tools will help identify, assess, mitigate, and monitor risks throughout the lifecycle of a project. Let’s dive into each of these risk management strategies.
1. Risk Assessment Matrix
The Risk Assessment Matrix is an essential tool for identifying and evaluating risks based on their probability and impact. It helps project teams to prioritize risks and decide on appropriate actions for risk mitigation. By rating risks from low to high, teams can calculate a risk score by multiplying the likelihood of a risk occurring with its potential impact. This process highlights critical risks that require immediate attention and control measures, allowing teams to focus their efforts where it matters most. Once mitigation actions are applied, the risk levels can be re-assessed and brought under control, reducing their potential impact on the project.
2. SWOT Analysis
A SWOT analysis (Strengths, Weaknesses, Opportunities, and Threats) is an excellent brainstorming tool for identifying risks. In the context of risk management, weaknesses represent internal risks within the project, and threats refer to external factors that could pose risks. For example, if a project depends heavily on the business owner’s brand, this could be considered a weakness. External threats could include competitor dominance in the market or economic downturns affecting consumer spending. The SWOT analysis helps teams analyze internal and external factors that could affect the project’s success and create proactive strategies to manage those risks.
3. PESTEL Analysis
Similar to SWOT, the PESTEL (Political, Economic, Social, Technological, Environmental, and Legal) analysis helps project managers assess external risks. This analysis provides a broader view of potential risks that could affect a project, such as changes in laws, political instability, or technological advancements. For instance, if a new AI-driven technology emerges, it could represent both an opportunity and a risk for a mobile app project like Pet Buddy. Identifying these risks early on can allow teams to take advantage of opportunities while mitigating threats before they materialize.
4. Decision Tree Analysis
Once risks are identified, it’s time to explore quantitative measures to understand the costs and benefits of various decisions. A decision tree analysis is a powerful tool for visualizing different decision paths, outcomes, and probabilities. By assessing various decision scenarios—such as choosing between two marketing strategies—project managers can determine the most cost-effective and impactful decision. For example, aggressive paid marketing may have a 60% chance of success, but a sponsorship approach might yield better returns with a higher probability. This tool helps project managers make data-driven decisions that optimize project outcomes while mitigating risks.
5. Force Field Analysis
Force Field Analysis is another technique used to assess the driving and restraining forces for a particular decision or change within a project. In risk management, it helps teams evaluate the pros and cons of a potential risk or opportunity. For example, when considering the development of an AI-driven matchmaking algorithm for the Pet Buddy app, the driving forces may include technological innovation and market demand, while the restraining forces might involve high development costs and potential algorithmic errors. By ranking these forces on a scale of 1 to 5, teams can assess whether the potential benefits outweigh the risks and make an informed decision.
6. Sensitivity Analysis (Tornado Chart)
The Sensitivity Analysis, often depicted as a Tornado Chart, is used to evaluate how sensitive a project is to certain variables. For example, the Pet Buddy project could look at how changes in the commission rate for pet sitters affect overall revenue. By adjusting different variables (such as the percentage of commission), a project manager can visualize the positive and negative impacts on revenue. This analysis allows teams to identify which factors are most critical to the project’s success and prioritize actions that will minimize risks associated with those factors.
Conclusion
Risk management is a crucial part of project management, and these six tools—Risk Assessment Matrix, SWOT Analysis, PESTEL Analysis, Decision Tree Analysis, Force Field Analysis, and Sensitivity Analysis—help project managers stay ahead of potential issues. By leveraging these techniques, teams can identify risks early, quantify them, and implement controls to minimize their impact on the project. The Pet Buddy mobile app project is just one example where these tools can be applied to ensure success, but they are equally effective in various industries and project types. By incorporating these tools into your risk management plan, you can navigate the uncertainties of any project with confidence, ensuring a smoother path to success.
Managing Resources Effectively in the Pet Buddy Project: Key Tools for Success
In the fast-paced world of project management, especially when working with a dynamic project like Pet Buddy, managing resources is crucial for success. The Pet Buddy project is a mobile app designed to match pet sitters with pet owners, much like the “Uber for pet stays” concept. Samantha, the business owner, initiated this project with a clear vision and business case, and now, it’s time to turn that vision into a reality by effectively managing the team and their roles. In this article, we will explore four essential tools to manage resources and ensure the project’s success: the RACI chart, Team Charter, Meeting Cadence Planner, and Retrospective.
1. RACI Chart: Clarifying Roles and Responsibilities
One of the first steps in managing resources is ensuring clarity around roles and responsibilities. The RACI chart (Responsible, Accountable, Consulted, Informed) is an essential tool in this regard. By creating a RACI chart, the project manager, Billy, can ensure that everyone on the team knows exactly what is expected of them.
For the Pet Buddy project, Billy works with the team to assign clear roles for every task. For example:
Responsible: Developers Max, Olivia, Liam, and Isa are responsible for the source code.
Accountable: Max, the senior developer, is accountable for overseeing the source code and ensuring it meets the required quality standards.
Consulted: Senior User, Ben, provides expert judgment on project deliverables.
Informed: The project sponsor, Samantha, is kept informed about progress through regular project status reports.
The RACI chart is an effective way to make sure that tasks are not duplicated or overlooked, providing the clarity needed for the team to move forward.
2. Team Charter: Defining the Mission and Values
Once everyone knows their roles, the next step is to create a Team Charter, a document that outlines the mission, values, ways of working, and team expectations. For the Pet Buddy project, the charter clarifies why the project exists (to create an app for connecting pet sitters and pet owners) and sets the team up for success by defining how they will work together.
The Team Charter covers:
Project background: The need for the mobile app that facilitates pet stays.
Team roles and stakeholders: Clear identification of project sponsors, managers, analysts, developers, testers, etc.
Ways of working: Values like punctuality, availability, and commitment to collaboration.
Communication plans: Setting expectations for how the team will stay connected, whether through in-person meetings or communication platforms like messaging software or video calls.
Decision processes: Who makes the final decisions on scope changes, work adjustments, and estimates?
Having a Team Charter helps create a shared understanding of expectations and improves team cohesion, ensuring that everyone is on the same page from day one.
Meetings are an essential part of any project, but the key to successful collaboration is having the right number of meetings at the right times. Billy, the project manager, uses a Meeting Cadence Planner to ensure that the team meets as needed, but without overwhelming them with unnecessary discussions.
For the Pet Buddy project, the meeting cadence includes:
Daily stand-ups: A short daily check-in meeting where everyone shares what they worked on yesterday and what they plan to work on today.
User story elaboration sessions: Twice a week, the team comes together to clarify acceptance criteria and refine user stories.
Ad-hoc meetings: When necessary, the team gathers to resolve specific issues or make key decisions.
By using the Meeting Cadence Planner, Billy can keep the team focused on work while ensuring they have enough opportunities for collaboration, feedback, and decision-making.
4. Retrospective: Continuous Improvement
In any project, there’s always room for improvement. After every sprint or iteration (typically every two weeks), the team holds a Retrospective. This agile practice allows the team to reflect on what went well, what challenges arose, and what lessons can be learned.
The retrospective for the Pet Buddy project might cover:
What went well: Perhaps the team communicated effectively, or maybe the development was faster than expected.
Challenges: Maybe some items weren’t fully elaborated, leading to misunderstandings and delays.
Lessons learned: Initial task estimations could be more accurate in the future.
What still puzzles us: Any questions we need answered.
We should also have actions for improvement: Adjusting estimations, refining the scope definition, or improving communication.
This continuous feedback loop helps the team improve their processes and become more efficient over time, making them a high-performing group.
Conclusion
By implementing these four resource management tools – RACI, Team Charter, Meeting Cadence Planner, and Retrospective – the Pet Buddy project team can manage their time, resources, and relationships more effectively. These tools help the team stay aligned with their goals, communicate effectively, and continually improve their processes, ensuring the project’s success. Whether you’re working on a project like Pet Buddy or any other, these tools can set your team up for success, helping them deliver high-quality results.
Essential Project Cost Management Tools for Success
Managing project costs effectively is one of the cornerstones of successful project delivery. In this article, we’ll explore four key project cost management tools that every project manager should master, as outlined in the PMBOK Guide. Using the Pet Buddy project – a mobile app connecting pet owners with pet sitters – we’ll walk through how these tools are applied to ensure the project stays on budget and is financially successful.
1. Work Breakdown Structure (WBS) Dictionary with Cost Attributes
The first step in managing project costs is to clearly define the scope and the costs associated with each work item, with our Cost Estimates. The Work Breakdown Structure (WBS) Dictionary serves as a detailed record of the project’s scope, including estimates of the cost for each individual work item.
Additionally, these cost estimates can be enhanced by using commercial databases – resources that provide industry-standard pricing data for various project needs. These databases help refine cost estimates, making them more accurate and grounded in real-world pricing trends.
2. Bottom-Up Estimating
Once we’ve outlined the scope and cost estimates, the next step might include adding up those costs to an overall budget with Bottom-Up Estimating. This process involves calculating the cost of each small work package or task, then aggregating these costs to get the total cost of the project.
In Pet Buddy, the project manager would begin by estimating the cost of each individual feature (e.g., user registration, payment processing, pet sitter profiles). Afterward, these smaller costs are summed up to determine the overall budget for the app. This approach ensures that no detail is overlooked, and all costs are accounted for, resulting in a comprehensive budget estimate that reflects the entire project’s scope.
3. Project Budget (Planned vs. Actual)
With a detailed project budget in place, it’s essential to track the actual spending against the planned budget to ensure financial control. The Project Budget tool allows project managers to compare how much was originally budgeted for each aspect of the project versus what has been spent at any given point.
For Pet Buddy, a budget tracking system would automatically highlight where spending has exceeded the budget (marked in red) or come under budget (marked in green). This comparison allows the team to take corrective actions if certain features are running over budget, ensuring the project remains financially on track.
A Budget Trend Chart can visually display this data, helping project managers track financial performance over time. By comparing the actual cost (green) to the planned value (orange), project managers can quickly see if the project is on target, ahead, or behind financially, allowing for timely decision-making and adjustments.
4. Contingency and Management Reserves
Despite thorough planning and estimating, unforeseen issues can still arise, which is why Contingency Reserves and Management Reserves are crucial components of a project’s financial plan.
Contingency Reserves are funds set aside to deal with known risks or issues that are anticipated during the project. For instance, if there are potential delays in the app’s development due to vendor issues, a contingency reserve might be used to cover these additional costs. In the Pet Buddy project, the team has allocated $35,000 for such known risks.
Management Reserves, on the other hand, are intended for unforeseen changes to the project scope, such as adding new features or responding to changes in market conditions. Pet Buddy has set aside $80,000 for these types of unexpected changes.
It’s important to note that these reserves are not automatically spent but are accessed only when necessary and with approval from the appropriate stakeholders.
5. Periodic Funding Requirements and Milestones
Managing cash flow is critical in any project, and Periodic Funding Requirements ensure that the project has the necessary funding at each phase. For Pet Buddy, this means releasing funds at different milestones based on project progress.
The funding structure starts with an initial release of $200,000 to kickstart the project. As the app development progresses and key deliverables are completed, subsequent funding releases are made, contingent on meeting certain milestones. If the project progresses as planned, funding will be released according to the schedule, supporting the continued work on the app. If not, there may be delays or cutoffs in funding, which is why consistent progress is crucial to ensure the project remains financially viable.
A Milestone Chart visually maps out the project’s funding requirements at each phase, from initial development through to completion. It ensures that the team has the necessary resources at every stage of the project, while also providing stakeholders with clear visibility into the project’s financial health.
Conclusion
Project cost management is an ongoing and essential part of project success, and the tools highlighted above—WBS Dictionary with Cost Attributes, Bottom-Up Estimating, Project Budget (Planned vs. Actual), Contingency and Management Reserves, and Periodic Funding Requirements – are the backbone of ensuring that costs are carefully planned, monitored, and controlled.
By applying these tools, Pet Buddy’s project team can effectively manage costs, adjust to financial changes, and make informed decisions throughout the project lifecycle. Whether you’re working on a tech development project like Pet Buddy or a large-scale construction effort, these project cost management tools will help ensure that your project remains on budget and successfully meets its financial goals.
Mastering Quality Management Tools in Project Management: A Practical Guide
Quality management is at the heart of every successful project, ensuring that products or services meet the necessary standards and satisfy customer needs. In this article, we will dive into the six essential quality management tools that every project manager must know, with practical examples from the “Pet Buddy” project.
1. Test and Inspection Plan (Test & Evaluation Documents)
The first quality management tool in our toolkit is the Test and Inspection Plan. This tool outlines how testing will be conducted throughout the project, including acceptance criteria and the deliverables that need to be tested. In the Pet Buddy project, Macy, the test lead, and Jack, the tester, are responsible for creating these documents. The acceptance criteria define the steps needed for a deliverable to pass or fail the test.
Acceptance Criteria can be a series of steps to a requirement goal, or could be in the format of “Given, When, Then,” or “As a,” “I Want,” “So I can”.
2. Control Charts
Once testing begins, monitoring the performance of processes is vital, which is where Control Charts come into play. In the Pet Buddy project, a control chart was used to track pet booking vs. cancellations. The chart visually displays data to determine if processes are within an acceptable range, showing whether bookings are performing as expected or if cancellations are becoming an issue.
The chart includes an average line and control limits—often set at three standard deviations from the average. However, in practical terms, the chart may be adjusted for more sensitivity to monitor performance more effectively. If the data points fall outside of the control limits, it’s time for a deeper investigation into the cause of the variations.
3. Check Sheets
When defects occur, tracking them efficiently is essential. Check Sheets provide a simple yet powerful way to collect and categorize defects. In Pet Buddy, Macy and Jack use a check sheet to record defects such as booking failures, app freezes, and display issues. By tallying the defects, the team can quickly identify patterns and prioritize actions based on the frequency and severity of the issues.
4. Pareto Charts
A more advanced version of the check sheet is the Pareto Chart. This tool takes the defects recorded in the check sheet and organizes them from largest to smallest, highlighting the most common or impactful problems. In the Pet Buddy example, the Pareto Chart showed that a sitter availability mismatch was the leading defect, causing the most significant number of issues.
This chart leverages the Pareto Principle, which states that 80% of the problems come from 20% of the causes. By focusing on the top 20% of defects, the team can address the core issues that will lead to the greatest improvements. The Pareto Chart gives the project team a clear focus, ensuring that efforts are concentrated on solving the most critical problems.
5. Ishikawa Diagram (Fishbone Diagram)
Once the team identifies the defects to work on, the next step is root cause analysis, and this is where the Ishikawa Diagram (also known as the Fishbone Diagram) comes into play. This tool helps in identifying the underlying causes of a problem by visualizing the various potential factors that contribute to it.
In the case of the sitter availability mismatch in the Pet Buddy project, the team uses the Ishikawa diagram to explore the different categories of potential causes: People, Information, Process, and System. This structured brainstorming approach uncovers the root causes of the problem, helping the team determine the most effective solutions.
6. The Five Whys
An alternative method for root cause analysis is the Five Whys technique. This tool involves asking “why” repeatedly until the root cause is uncovered. For example, when analyzing glitches in the booking logic of the Pet Buddy app, the team might ask why the glitch is happening. The initial answer might be that the system allows two pet owners to book the same sitter at overlapping times. But by asking why further, the team uncovers that the true root cause is a lack of proper concurrency control in the booking system.
This iterative questioning helps dig deeper into the problem, ensuring that the actual cause is addressed, rather than just the symptoms.
Conclusion
Quality management is an ongoing process throughout the life of a project. From identifying defects and monitoring performance to uncovering root causes and implementing solutions, the tools we’ve discussed—Test & Evaluation Documents, Control Charts, Check Sheets, Pareto Charts, Ishikawa Diagrams, and the Five Whys—are essential for maintaining the highest standards.
In the Pet Buddy project, these tools allowed the team to identify and address issues early, improve the user experience, and ensure that the final product met both business goals and customer expectations. Whether you’re working on a small project or a large-scale initiative, these quality management tools will help you deliver successful outcomes, just like Pet Buddy’s project team did.