– Back to Lean Glossary –
Fishbone Diagram: What Is It?
First implemented by Kaoru Ishikawa, a Fishbone diagram is a method of getting to the root cause of a problem, challenge or opportunity. It is often used in conjunction with a Kaizen meeting or event, and the 5 Whys.
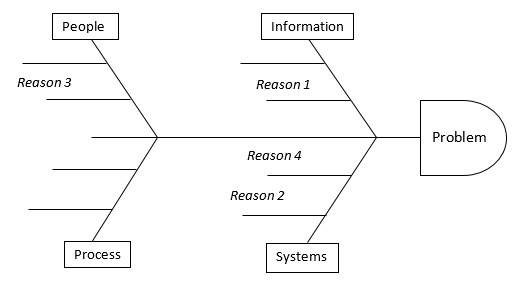
To use a fishbone diagram, the problem (or “effect”) is stated at the “head” of the fish, and different areas are noted as the “bones” of the fish.
Traditionally from manufacturing environments, the bones for each area were noted as:
- Man
- Material
- Method
- Machine
In an office environment, it is often clearer and easier to state the areas as “PIPS”:
- People
- Information
- Process
- Systems
With a fishbone diagram, you brainstorm reasons with your team for why the problem is happening, and associate these with each area.

Once completed, these reasons are grouped together – for instance there may be three main “causes” that are similar, but relate to people and to process. They are given the same number so the causes can be chunked together. We can then delve deeper using the Five Whys.
Also check out this excerpt on finding the Root Cause from the book Five Minute Lean! It goes into the 5 Whys, Fishbone Diagrams and more.
– Back to Lean Glossary –