All posts by David McLachlan

Poka Yoke or Error Proofing: Lean Glossary

– Back to Lean Glossary –

Poke Yoke: What Is It?

Poka Yoke (po-kah yo-keh) is a Japanese term that literally means “Mistake Avoid”.  Translating to its English counterpart, it becomes “Error Proofing” and this is how it is used in Lean.

Error Proofing means using methods in a process step that helps our team-mates avoid making mistakes.  In other words, anything that makes it close to impossible to make a mistake becomes our Error Proofing ally in Lean.  The most common example of Error proofing is the household electrical plug – whose cable end is the exact shape and size to fit properly into the wall socket.  A USB stick that will only fit in a USB port in your computer is another great example of things that are nearly impossible to get wrong.

The idea translates to any work process with only a little imagination.  We have online forms with set, specific drop down menus, or character limits for credit card payment fields.  There are dispensers that only dispense the exact amount of an item required, and there are bar codes that are used to scan and record the exact item to avoid human error.

No matter what your line of business, you can find a way to “error proof” it.

By David McLachlan

– Back to Lean Glossary –
Pareto Chart: Lean Glossary

– Back to Lean Glossary –

Pareto Chart: What Is It?

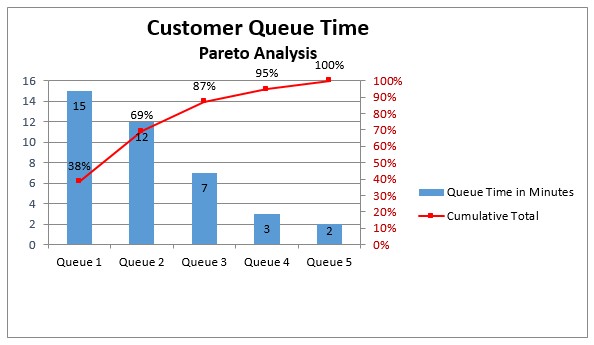
A Pareto Chart is a tool that refers to “Pareto’s Principle”, where it is common for 80% of results to come from 20% of the effort or inputs.  While these numbers are not set in stone they are often close, with similar percentages such as 70% of your problems coming from 30% of your processes, and so on.

Pareto Charts are often used to determine where you might get the best return on your effort when doing a Lean transformation – by focusing on the item that is causing the most problem.

To use a Pareto Chart:

  1. We get the data around the process or problem we are looking at and arrange it from largest to smallest in a bar chart.
  2. We then take the cumulative amounts (as a percentage) and overlay these as a line chart.  This will result in the bar chart moving down, and the cumulative line moving up.

Using this, you should be able to see at a glance where you will get the most return on focusing your effort.  Many people mark the “80%” line, so they can see where the majority of problems or opportunities lie.

– Back to Lean Glossary –

Overburden or Muri: Lean Glossary

– Back to Lean Glossary –

Overburden (Muri): Lean Glossary

Overburden or Muri is where team-mates or equipment are required to work harder, faster or more than is necessary, often because of wasteful steps or processes.

Reducing Overburden is one of the key reasons for implementing Lean.  You will see it during your transformation project in reducing rework, using 5s to keep areas tidy and tools close at hand, increasing visibility and streamlining processes to make things easier.

– Back to Lean Glossary –

Net Promoter Score: Lean Glossary

 – Back to Lean Glossary –

Net Promoter Score: What Is It?

The Net Promoter Score is a method of gauging customer satisfaction that was outlined in “The Ultimate Question 2.0” by Fred Reichheld.  It is a simple method that involves asking a customer after they have received their product or service the following question:

  • “On a scale of 1 to 10, how likely would you be to recommend us to a friend?”

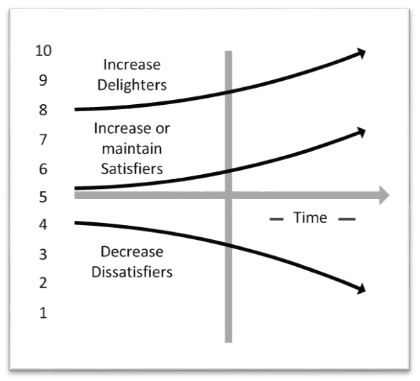
The results can often be output into a Kano model, outlining delighters, satisfiers and dissatisfiers based on how high the score is.

The most common mistake people make, however, is not including the follow-up to this “Ultimate Question”.  And that is, if a customer rates your product or service less than an 8 to ask the next question:

  • “And what would it take to make it a 10?”

This allows your customer to tell you in a safe environment, free of judgement, exactly what would “delight” them and how you can make your product or service the best it can be.  It also has the power to save you a lot of time in analysing the problem by simply asking.

– Back to Lean Glossary –

Line Balancing: Lean Glossary

 – Back to Lean Glossary –

Line Balancing: What Is It?

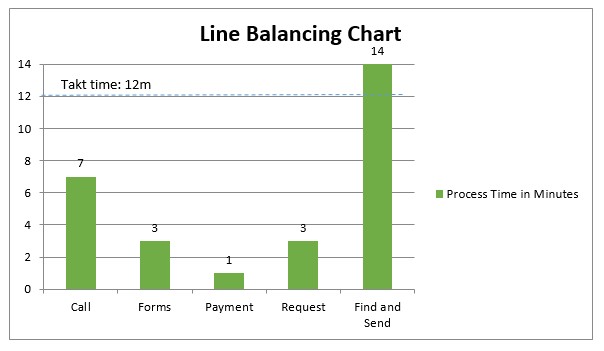
Line Balancing is based on the premise that a process is only as fast as its slowest part.   A line balancing chart shows us our process steps in order, with timings (usually as a bar chart).   It then becomes easy to see the processes and how long they take.

In many cases we can combine the faster processes together – reducing queues, wait time, re-work and working towards one-piece-flow, and together they will still be faster than the slowest part and takt time.  Sometimes there is more than one “slowest” part in a process.

To perform line balancing, we take the times for each part of a process and put them in order on a bar chart.  A line is drawn in to show the time of customer demand, or takt time.

lean line balancing chart

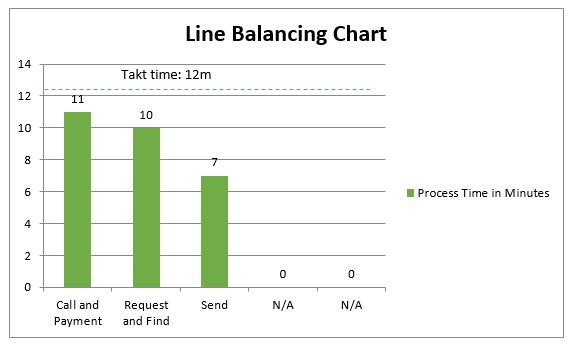
We then look at the faster processes and see which ones we might be able to combine, while still keeping them faster than the slowest process.  We can also look at the slower processes, and see where we can split them up, so that if they are performed in parallel (at the same time) it can speed up the overall process.

lean line balancing chart

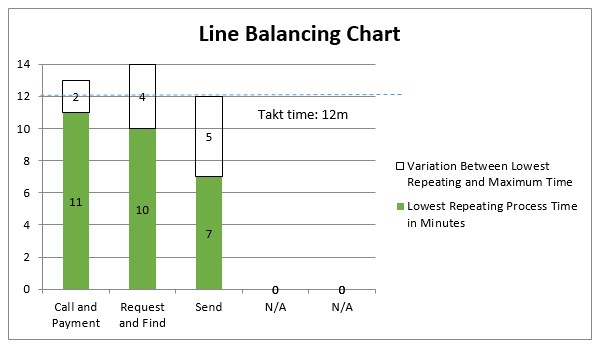
You can also include the “variation” in your process, with a dotted line or empty bar.  This way you will know the maximum it has been, while keeping in mind the average as well.

lean line balancing chart

– Back to Lean Glossary –

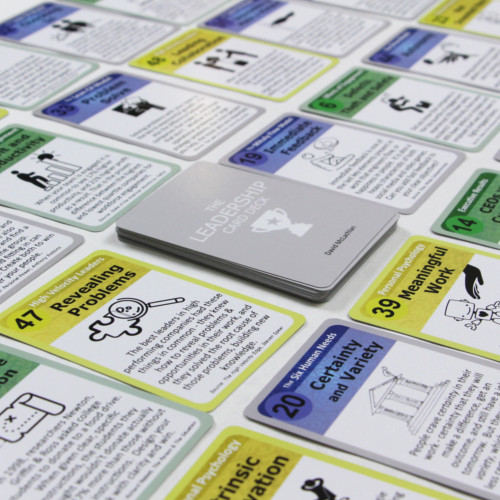
Get the Leadership Card Deck or the Five Minute Lean Book:

Leadership CardsView All The Leadership Cards (48)

- or - Have the Leadership Cards delivered for your next meeting


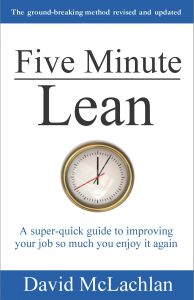
Want to learn about Lean? Get the book "Five Minute Lean", by David McLachlan - a wonderful book that blends teaching of the tools, culture and philosophy of traditional Lean with a modern-day Lean parable. You can get the whole book on Amazon here and enjoy your own copy.

Kano Analysis: Lean Glossary

 – Back to Lean Glossary –

Kano Analysis: What Is It?

Kano Analysis is a method of measuring customer satisfaction.  Data from customer satisfaction surveys (like the Net Promoter Score) are taken and output to a graph that shows how well a task was performed on the horizontal axis, and the level of customer satisfaction on the vertical axis.

This results in “Delighters” being in the top quadrants, “Satisfiers” through the middle and “Dissatisfiers” in the bottom quadrants.

The three main customer needs that should be met and improved in order to improve your Kano score and constantly “delight” your customers are:

  1. Expected Needs, that are the basic must have qualities expected in a product.
  2. Normal Needs, that are the wants of a customer in a product – things that a customer wants and will pay for.
  3. Exciting Needs, that are the “wow” level qualities of a product, positive surprises and extra touches that create raving fans.

You should be warned that over time, Normal needs become “expected” in the market place, and often Exciting needs become “normal”.  You must not remain stagnant if you are to keep delighting your customers.

lean kano analysis

A company that is continually giving all a customer’s musts or Expected needs, plenty of customer wants or Normal needs, and the best wow factors or Exciting needs is the company that gets ahead and stays ahead in their field.

– Back to Lean Glossary –

Kanban: Lean Glossary

 – Back to Lean Glossary –

Kanban: What Is It?

Kanban is the Japanese term for “Signboard”.  It is a way of signalling that gives authorisation and instructions for the production of items in a Pull System.

The most common form of Kanban is a card that holds the relevant information on it, telling an upstream process the type and quantity of products to make for a downstream process when the demand arises.

Kanban is therefore an important part of a Pull System, where items are produced at the demand of the downstream process or customer.  It also works well with a Supermarket, where a small inventory is kept and a Kanban is sent when the inventory is running low or emptied.

– Back to Lean Glossary –

Flow: Lean Glossary

 – Back to Lean Glossary –

Flow: What Is It?

Flow is defined as the Flow of a product as it moves through a process.  In Lean, the aim is “Continuous Flow”, where a product can move through the process stream uninhibited by queues, wait time, down time, re-work or other wastes, and with each step making only what is requested by the next step.

The ultimate Flow is “One Piece Flow”, where a product is made in as close to one place and time as possible and at the demand of the customer.

Flow production was introduced originally by Henry Ford, with the aim to drastically reduce human effort and the throughput time of the product.

– Back to Lean Glossary –

Fishbone or Ishikawa Diagram: Lean Glossary

 – Back to Lean Glossary –

Fishbone Diagram: What Is It?

First implemented by Kaoru Ishikawa, a Fishbone diagram is a method of getting to the root cause of a problem, challenge or opportunity.  It is often used in conjunction with a Kaizen meeting or event, and the 5 Whys.

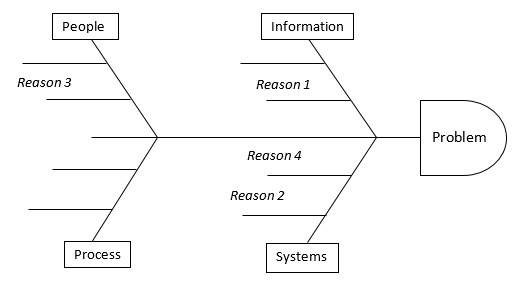
To use a fishbone diagram, the problem (or “effect”) is stated at the “head” of the fish, and different areas are noted as the “bones” of the fish.

Traditionally from manufacturing environments, the bones for each area were noted as:

  1. Man
  2. Material
  3. Method
  4. Machine

In an office environment, it is often clearer and easier to state the areas as “PIPS”:

  1. People
  2. Information
  3. Process
  4. Systems

With a fishbone diagram, you brainstorm reasons with your team for why the problem is happening, and associate these with each area.

fishbone diagram

Once completed, these reasons are grouped together – for instance there may be three main “causes” that are similar, but relate to people and to process.  They are given the same number so the causes can be chunked together.  We can then delve deeper using the Five Whys.

Also check out this excerpt on finding the Root Cause from the book Five Minute Lean! It goes into the 5 Whys, Fishbone Diagrams and more.

– Back to Lean Glossary –

FIFO Lane: Lean Glossary

 – Back to Lean Glossary –

FIFO Lane: What Is It?

FIFO Lane stands for “First In, First Out”.  It is the method of ensuring that the first part to enter a process or storage location is also the first to be used or taken.

A good example of this is the bread isle in your local supermarket, where bread is loaded at the top of the lane, and typically taken from the bottom.  This ensures that the oldest bread is taken first.

A FIFO Lane works extremely well with other Lean Principles.  If the lane is full, no more product needs to be made (avoiding over production).  An Andon can be used as a visual trigger for full or empty lanes.  As an item is taken, it can trigger production once again, and this is often done with a Kanban.  As product is only made as it is pulled by the customer, it becomes an excellent example of a Pull System.

– Back to Lean Glossary –