All posts by David McLachlan

Five Minute Lean – Work Towards One-Piece-Flow (and Reducing Silos or Batching)

Five Minute LeanThis is an excerpt from the book "Five Minute Lean", by David McLachlan - a wonderful book that blends teaching of the tools, culture and philosophy of traditional Lean with a modern-day Lean parable.

You can get the whole book on Amazon here and enjoy your own copy.

Work Towards One-Piece-Flow (and Reducing Silos or Batching)

‘One Piece Flow allows us to create our product or service smoothly and to customer demand, one piece at a time, reducing inventory, queues and work in process.’

One Piece Flow is where, instead of many different departments or processes creating large amounts of material or work, it is done in as close to the one place and at the same time as possible.

It also means that our product moves from step to step continuously, one piece at a time and with no build-up of work in between.  In our Line Balancing example (3.4) there would always be one piece (and only one piece) working for each step, and those steps would be balanced to customer demand (Takt time).

One of the main ideas behind this is that by only working on one piece at a time until completion, if anything stops or holds up the process it becomes very clear, as the process simply cannot continue.  It reveals problems, which is good as they are opportunities for us to improve, and we can then look at these problems as they arise instead of pushing them aside for later.

Performing the work in the same place and time, whether it is a physical space or using a single computer program, significantly reduces wait time between processes, reduces unnecessary people or tasks, saves on space, machines and resources and gives an opportunity for simpler management.

One piece flow is also opposed to “batch processing”, where items build up in a process causing larger inventories, longer queue times and rework.

Many of the eight wastes (3.1) will affect one piece flow.  Unnecessary movement, transport, additional process steps or unevenness in a process can all slow things down.  We can use our value stream map to see some of this waste, then root cause analysis to get to the real problem, and Line Balancing to see any variation in timings and balance the process to customer demand.

A Pull system, including Supermarkets and FIFO lanes and Kanban triggers in the next chapter (4.1) can also greatly assist with implementing one piece flow.  Before we finish this chapter let’s look at one last thing:

SMED and Quick Changeovers

Just a quick note on Single Minute Exchange of Dies (SMED), which is another way of saying “quick changeover” techniques.  Sometimes our process might have long wait times as we change between processes, people, machines, systems or tools.

While it is easy to see how a quick changeover can apply to a manufacturing machine creating two different items, it can apply to an office environment in the form of changing between people or processes as well.  Brainstorming ways to change over quickly, based on the instructions below can help reduce this wait time.

The method for quick changeovers is based on two types of changeover operations which should be separated from each other:

  1. Internal, or “hidden” operations, which can only be done separately and when the person, process or machine is stopped, and;
  2. External, or “visible” operations, which can be done in parallel while the person, process or machine is still going.

The aim is to reduce any waste (3.1) in the changeover, and then to:

  1. Convert any Internal (hidden) changeover operations to External (visible) changeover operations.
  2. Perform these changeover steps in parallel to each other (at the same time) or while the process is still running.

Can a client’s details be filled out by someone, in parallel, while they are having their consultation?  Or could a person changing roles within an organisation complete some of the changes themselves by making an internal, or hidden process, external and accessible?  With a little imagination, we can transform our job and make it easier, which is why our first step would always be to “go and see” at the Gemba.  Front-line team-mates often have great ideas on how to make hidden processes visible and complete changeover steps in parallel.

By putting all the steps in this chapter together we are reducing blockages, wait time, employee and customer confusion and unnecessary steps.  Just doing this alone has the potential to add massive value to your company, department or business, and there are still more ways in the last two chapters to help you improve your work even further.

Five Minute LeanThis is an excerpt from the book "Five Minute Lean", by David McLachlan - a wonderful book that blends teaching of the tools, culture and philosophy of traditional Lean with a modern-day Lean parable.

You can get the whole book on Amazon here and enjoy your own copy.

Selected chapters from the story within Five minute Lean:

Check out these selected chapters from the teachings within Five Minute Lean:

Five Minute Lean – Add Important Data to Your Map

Five Minute LeanThis is an excerpt from the book "Five Minute Lean", by David McLachlan - a wonderful book that blends teaching of the tools, culture and philosophy of traditional Lean with a modern-day Lean parable.

You can get the whole book on Amazon here and enjoy your own copy.

Add Important Data to Your Map

‘Including the right information on your process map allows you to see areas where you can improve straight away.’

The last step in “Map” is adding the right information to our Value Stream Map so we can reveal problems and improve the process.  This data includes:

  1. Rework or defects
  2. Additional problems or ideas called out by front-line staff
  3. Non-value added steps
  4. Process and customer timing

Let’s look at each one in turn, and then an example at the end.

Rework Percentages

Rework can also be known another way as “First Pass Yield” or “First Time Right”.  Basically, this is how many times you need to go back through the previous steps to get additional information or fix a defect, for example a car that needs repainting, or a form that is not filled out correctly and needs more information from the previous department.

If our item goes through correctly 70% of the time, then we have a “First Pass Yield” of 70%.  Or, if you prefer, you can note it as rework, which is one of the wastes we go into in (3.1) and in which case it would be reworked 30% of the time.

Kaizen Bursts

You will notice in our Value Stream Map icons that there is an icon called Kaizen Burst.  A Kaizen Burst icon is a great way to write down additional ideas or problems called out by our front-line team-mates.

We can then delve deeper into these additional problems and solutions when we move into root cause analysis (3.3) and brainstorming solutions.

value stream map kaizen bursts

 Figure 10: Examples of using Kaizen Bursts to call out opportunities for improvement.  Note that we number opportunities to correspond with the process step they relate to.

Value Add / Non Value Add Steps

If the process task improves the product, or the experience of the customer and it is something our customer is willing to pay for, we consider it Value Add (VA).  Almost everything else is Non-Value Add (NVA) or waste that we can seek to reduce.

We can also note NVAR or “Non-Value Add Required” steps, that might include things like regulatory approvals or audits that don’t add value but are necessary to perform.

Timing our Processes

We can display these value add (VA) and non-value add (NVA) steps with a process timing band.  In a Value Stream Map, the timings for our NVA steps stand out on the peaks, and the timings for the VA steps stay in the valleys underneath our map, shown in Figure 11.

value stream map non value add timing

Figure 11: An example of Value Add (process boxes) and Non-Value Add (queues) in a process map, shown by the timing band underneath each process.  Value Add steps are shown in the valleys, while Non-Value Add steps stand out on the peaks.

When gathering the timings for our process it is a good idea to time a process at least 10 times, then use the “lowest repeatable time” as the standard – the lowest time that appears three times or more.  You may need to time more for fast processes and slightly less for slow processes, but 10 is often a good place to start.

There are also three main types of timings that we need to reveal:

  1. Cycle Time, which is the time of a single process. This is noted underneath the process step.
  2. Lead Time, which is the total time to create and deliver a product or service. This can be noted at the end.
  3. Takt Time, which is the rate of items required as determined by the customer, for each shift.

To get our Takt time, we take the average items sold (or serviced) and divide it by the hours worked.  For example if Lisa’s customers called through 40 times a day (per operator) and she worked eight hours (480 minutes), her customer demand would be one every 12 minutes (480 minutes, divided by 40 calls = 12 minutes a call).

Of course, all of these timings relate to “Delivery” in our Customer Driven Metrics (1.2).  Now that we have all this information, let’s add it to our Value Stream Map and see what it looks like:

value stream map with data

Figure 12:  A Value Stream Map of our Shoe Emporium process, now with rework, process timing separated into Value Add and Non-Value Add as well as the other common icons.  The Takt time can be added separately.

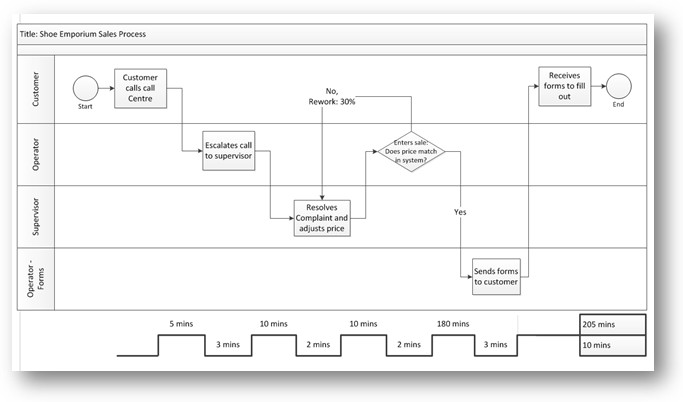
swim lane flow chart timings

Figure 13:  A Swim Lane Flow Chart of our Shoe Emporium process.  Although it is uncommon for a map like this, the important NVA times (the top times) and VA times (the bottom times) are also noted, with the totals on the right. 

So well done!  There is a lot to take in in this chapter, but you did it.

On your journey you will notice that different people and organisations might lay out their maps slightly differently.  As long as there is an agreed standard within your company, then including the information listed in this chapter at a minimum will give you enough insight to start making improvements.

If you are doing all of this for the first time, it can be a truly eye-opening experience.  There might have been something that annoyed you in your job or business that you just couldn’t put your finger on – but when you map it all out you can actually see it.  You can see where the hold ups are, the rework, bottlenecks in the process and more.  It’s amazing, and it can really improve your work and your life.

Five Minute LeanThis is an excerpt from the book "Five Minute Lean", by David McLachlan - a wonderful book that blends teaching of the tools, culture and philosophy of traditional Lean with a modern-day Lean parable.

You can get the whole book on Amazon here and enjoy your own copy.

Selected chapters from the story within Five minute Lean:

Check out these selected chapters from the teachings within Five Minute Lean:

Five Minute Lean – Use Feedback to Fix and Guarantee

Five Minute LeanThis is an excerpt from the book "Five Minute Lean", by David McLachlan - a wonderful book that blends teaching of the tools, culture and philosophy of traditional Lean with a modern-day Lean parable.

You can get the whole book on Amazon here and enjoy your own copy.

Use Feedback to Fix and Guarantee

‘Fixing and guaranteeing the things our customer finds annoying is an immensely powerful way to gain raving fans.’

Many industries will have their pet hates – things that have become almost clichés as they annoy customers in that industry the most.  Perhaps you’ve had the cable technician who never turns up on time, or the call centre operator who moves slower than a glacier.  Great companies and businesses that survive the longest are ones that take this into consideration and do something about it.

One of the most simple and powerful methods we can use here is to:

1.  Find out what annoys the customer most

Discover what annoys your customers by using the Net Promoter Score “Dissatisfiers”, and collecting customer complaints.  Examples of this step might include a tradesperson that doesn’t show up, clothes bought from an online store that don’t fit, or food that is cold when it’s delivered.

2.  Fix it

Imagine if your tradesperson actually did show up right on time, every time?  Or your clothes were either the right size or you could exchange them?  Or your food really was delivered hot and fresh for every order?  We can fix what annoys customers the most using the tools in this book.

3.  Then guarantee it

Now imagine if your tradesperson showed up on time, guaranteed?  Or your clothes were the right size or you could exchange them for free, guaranteed?  Or your food was delivered hot and fresh guaranteed, or it’s free?

These three steps are truly one of the fastest ways to get yourself raving fans, and raving fans turn average earnings into outstanding earnings.

The examples above were not just chosen at random either – they are real life examples of outstanding companies.  Domino’s Pizza implemented the idea of pizza delivered in 30 minutes or it’s free, guaranteed and the company has gone from strength to strength in business and in its stock price since.

Zappos is an online clothing and footwear company that implemented a 365 day return policy (effectively a satisfaction guarantee), and has grown from a small online store to turning over more than a billion dollars a year.

And lastly, local tradespeople who show up on time, guaranteed, have more work than they need and can often charge more than the average as well.

When you combine all of the five steps in “Define Value” you have a quick and easy way to get insight into what brings your customer value and what they would be willing to pay for.  This is truly powerful information, and can save you a lot of heartache down the track, whether you are just starting a business or improving an existing one.

Five Minute LeanThis is an excerpt from the book "Five Minute Lean", by David McLachlan - a wonderful book that blends teaching of the tools, culture and philosophy of traditional Lean with a modern-day Lean parable.

You can get the whole book on Amazon here and enjoy your own copy.

Selected chapters from the story within Five minute Lean:

Check out these selected chapters from the teachings within Five Minute Lean:

Five Minute Lean – Create a New Standard Procedure and Checklist for Quality Control

Five Minute LeanThis is an excerpt from the book "Five Minute Lean", by David McLachlan - a wonderful book that blends teaching of the tools, culture and philosophy of traditional Lean with a modern-day Lean parable.

You can get the whole book on Amazon here and enjoy your own copy.

Create a New Standard Procedure and Checklist for Quality Control

‘When your process can be performed easily by someone straight off the street, then chances are you have an excellent Standard Operating Procedure.’

And now finally we come to the point of it all!  A standard, repeatable process that anyone can learn, teach to others, and quality check.

You will find that most businesses, even ones you have worked for, do not have clearly written, standard, repeatable processes for the work that they do.  This means that the work is often “hidden”, finishing very differently from person to person and relying on large amounts of expensive training, experience or even highly paid experts.  Therefore, by simply articulating a standard process (making it visible) first, and then using the knowledge in this book to improve it, you can see some incredible rewards.

Taking our future state process and ensuring we have tested it well, we can now create a new Standard Operating Procedure (SOP) for people to carry out the same way every time, or use as a new baseline for future improvements.

The most common inclusions are a set of main tasks, and then sub tasks – simple step by step instructions from the beginning to the end of the process.  A good process checklist will also include the takt time, or the rate required as per customer demand, the lowest repeatable cycle time (2.5), and relevant pictures, safety and risk notes.

When team-mates are using the same checklist as the person who is measuring their KPIs (Key Performance Indicators), then everyone is on the same page and their job is made that much better, easier and enjoyable.  There is nothing worse than trying to do a good job while being judged or monitored on different rules (or rules that are always changing or are not clearly defined).  This step truly has the power to fix these inconsistencies in an organisation.

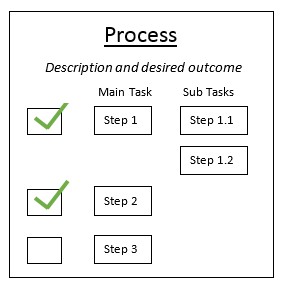
lean process checklist

Figure 30: A checklist for your standard procedure doesn’t have to be complicated.  Keep it simple so anyone can create and follow it.  Many people separate their SOPs into a handful of main tasks, and then sub tasks next to each related main task.

It’s a good idea to keep your standard checklists in a central location where everybody has access to them, in addition to making them visible at the workstation and rolling them out to the people performing the process, the people training the process and the people monitoring the process.

Five Minute LeanThis is an excerpt from the book "Five Minute Lean", by David McLachlan - a wonderful book that blends teaching of the tools, culture and philosophy of traditional Lean with a modern-day Lean parable.

You can get the whole book on Amazon here and enjoy your own copy.

Selected chapters from the story within Five minute Lean:

Check out these selected chapters from the teachings within Five Minute Lean:

Five Minute Lean – Organise Your Process with Five S

Five Minute LeanThis is an excerpt from the book "Five Minute Lean", by David McLachlan - a wonderful book that blends teaching of the tools, culture and philosophy of traditional Lean with a modern-day Lean parable.

You can get the whole book on Amazon here and enjoy your own copy.

Organise Your Process with Five S

‘Organising a workplace with Five S reduces risk, increases safety, makes it easy to reach and find things and know when they are running out.’

In Lean, Five S (also “5S”) is a method used to create an organised, clean and safe work area where things are visible, easy to reach and easy to find.  This can also help in reducing waste, cycle times, overburden and stress and help implement your Pull system.

It doesn’t just have to be a physical space either – in the world of technology it can mean reducing different and unnecessary programs, sorting out unnecessary fields in your software or forms, or reducing the many folders or areas we keep work, results, forms or code.

The five S’ are:

1.  Sort

Sort out and remove any unnecessary items.

2.  Straighten

Organise the remaining essential items so team-mates can find materials quickly and reach them easily.

3.  Shine

Clean the area and work tools.

4.  Standardise

Make the standard process and the designated places for each item clearly visible for all to see.

5.  Sustain

Put into place regular sorting and review of the necessary items and the implementation, for continuous improvement.

In other words, we have a place for our necessary things, and our necessary things in their place.

A nice example of 5S in a physical space is a “Shadow Board” – where shadows of the tools are put behind tools hanging on a wall so you know what goes where and can always see if something is missing.  This idea can also relate to a Kanban trigger (4.1) to replenish an item.  If the marked space is empty, this might trigger the upstream process to produce and place a new item there.

Item “footprints” are a similar idea – outlines and labels to show where items belong.  All items should be close at hand, requiring minimal movement.

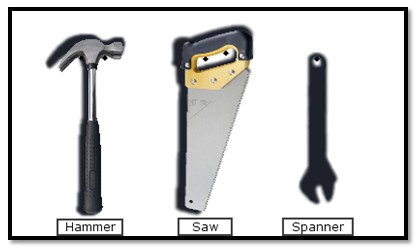
shadow board visual management

Figure 25:  An example of a shadow board, where the shadow behind the tool makes it easy to see what goes where, and when a tool is missing.  Great visual management that can be seen at a glance.

Implementing 5S

“Red tagging” items to begin our 5S is one of the easiest ways to start.  We tag items with red tags or post it notes, and take them off if the item is used.  This way it becomes clear if we have any items that we don’t need, and can “Sort” them out.  Doing a tally of how often fields are used in a software program (if at all) is another good way to tell if the field is truly necessary or not.

After we sort, “Straightening” an area can mean clear labels on storage boxes that help keep things in their proper place, and having items or tools within arm’s reach so a team-mate doesn’t have to move far to get them.  This helps improve speed and quality.

When we want to “Standardise”, it is also a great idea to show the standard process clearly on the wall of the area, making it visible for everyone to see (4.1).  For example, you could place instructions for keeping an area clear or for storing things that come in, or the steps of the actual process performed in this area.

“Sustaining” a 5S effort is often done by making a roster clearly visible, with the date 5S was last performed and the date and name of the next person to perform it.

Five Minute LeanThis is an excerpt from the book "Five Minute Lean", by David McLachlan - a wonderful book that blends teaching of the tools, culture and philosophy of traditional Lean with a modern-day Lean parable.

You can get the whole book on Amazon here and enjoy your own copy.

Selected chapters from the story within Five minute Lean:

Check out these selected chapters from the teachings within Five Minute Lean:

Five Minute Lean – Help Your Process Flow with Line Balancing

Five Minute LeanThis is an excerpt from the book "Five Minute Lean", by David McLachlan - a wonderful book that blends teaching of the tools, culture and philosophy of traditional Lean with a modern-day Lean parable.

You can get the whole book on Amazon here and enjoy your own copy.

Help Your Process Flow with Line Balancing

‘A Line Balancing chart shows you where you can combine or split processes, to save wait time, reduce hand-offs and ensure you meet customer demand, all at a glance.’

Lisa might use this once she has done her Value Stream Map (2.4) with timings, and wants to see if she can make the experience faster for the customer. Line balancing is where we improve Flow by balancing out the steps in our process, so that they are faster than the rate of customer demand, or Takt time.  This can mean combining steps where possible to eliminate queues or wait time, or splitting steps into smaller parts so they can be performed more quickly than our customer demands.  A Line Balancing Chart helps us visualise it so we can see where we can improve.

As usual, a picture is worth a thousand words – let’s look at the process steps we started with in our SIPOC (2.3):

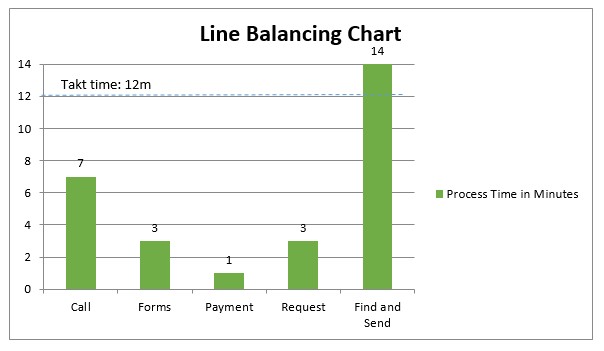
lean line balancing chart

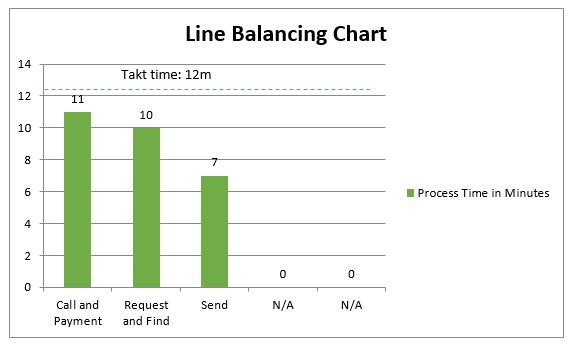
Figure 16: Example of our initial line balancing chart, where each process step is being performed at the same time as they move along a “production line” that is always full.

In the example above we have a service that needs to be produced once every 12 minutes to meet customer demand.  In other words, 12 minutes is our Takt time.

To create this service, we have five process steps.  Our timings look like this in minutes:  7, 3, 1, 3, 14.  Every step is always working, as items constantly move through the creation process.

Our two longest processes are 7 minutes and 14 minutes each.  We also have a problem, because if one step is taking 14 minutes and we need one every 12 minutes, we won’t meet our customer demand.

So how do we balance this workflow?

We can see that the second longest process (step one, “Call”) is 7 minutes.  Steps two and three after it, however, only add up to four minutes (3 + 1).  So we have the opportunity to combine the first three steps to reduce the number of total steps, with the added benefit of eliminating queues or wait time in between.

Step 5, however, is 14 minutes – 2 minutes over our Takt time.  We can split this step into two, or add some of it to another step in order to bring it under 12 minutes.

Doing this and balancing out our process steps, we have a much more streamlined process with less wait time, fewer handoffs and that we know meets customer demand.

lean line balancing chart

Figure 17: Example of our process after performing line balancing – some steps are combined, reducing queues in between, and one step is split up, ensuring our longest process is still under Takt time.

Using a Line Balancing Chart to Start Initiatives

Using a Line Balancing chart to start an improvement initiative is easy – we just need to reveal the right things.

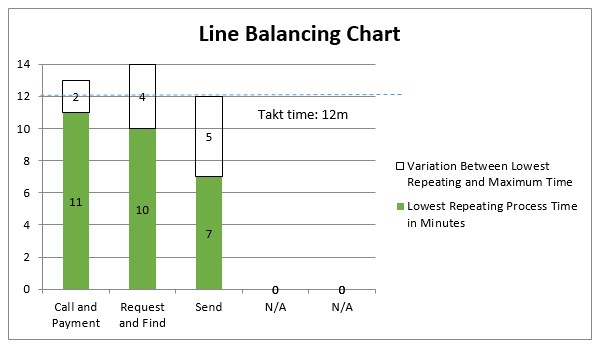
Remember, when timing a process we do so a minimum of ten times and use the lowest repeating time (2.5).  However, we can also draw in the maximum time for each step.  This will show us the lowest repeatable time versus the maximum time, with the time between them revealing any variations in time when performing the process.  And what causes these variations?  You guessed it – waste (3.1) and not having or following a standard process (5.4).  This variation can be a good opportunity to focus a Lean initiative on.

This is why problems are such great opportunities.  Once the process is improved, we can create a new standard process based on the changes, and then improve it again.

lean line balancing chart

Figure 18: An example of a Line Balancing chart showing variation in times when performing a process.  This variation is the perfect opportunity for a Lean improvement initiative.  

We could potentially reduce this variation and the time of any remaining steps as well.  Getting rid of NVA steps or processes (2.5), getting rid of the Eight Wastes (3.1), using quick changeover techniques (3.5) or adding error proofing and Autonomation (4.2), using 5S to organise work-stations and keep items close at hand (4.4) can all help reduce and balance out our remaining total Lead time even further.

Five Minute LeanThis is an excerpt from the book "Five Minute Lean", by David McLachlan - a wonderful book that blends teaching of the tools, culture and philosophy of traditional Lean with a modern-day Lean parable.

You can get the whole book on Amazon here and enjoy your own copy.

Selected chapters from the story within Five minute Lean:

Check out these selected chapters from the teachings within Five Minute Lean:

Five Minute Lean – Map the Value Stream to Reveal Opportunities

Five Minute LeanThis is an excerpt from the book "Five Minute Lean", by David McLachlan - a wonderful book that blends teaching of the tools, culture and philosophy of traditional Lean with a modern-day Lean parable.

You can get the whole book on Amazon here and enjoy your own copy.

Map the Value Stream to Reveal Opportunities

‘Mapping the process in this way, you can see your entire process at a glance, including any blockages or sticking points to fix.’

A Value Stream Map (VSM) is a map of the flow of steps for creating our product or service.  It can be done at a high level, between departments or a low level, in a single task.  Because of this, mapping the value stream is a good way to create a standard operating procedure (5.4), if one doesn’t already exist.  This is also the method that Steve taught to Lisa and encouraged her to try with her teammates, and in doing so they revealed a number of problems and opportunities.

In fact that is the reason we map our value stream: to reveal opportunities in our process for us to improve.  Things like long process times, many queues, having to redo work, or information travelling between too many departments.  All of this is referred to as “waste”, which we go into in more detail in (3.1).

You should know that there is a lot of information packed into the next two sections, and learning how to make a value stream map can seem daunting at first.  However, at the end you will be able to see your process at a glance, and it is a very powerful tool.

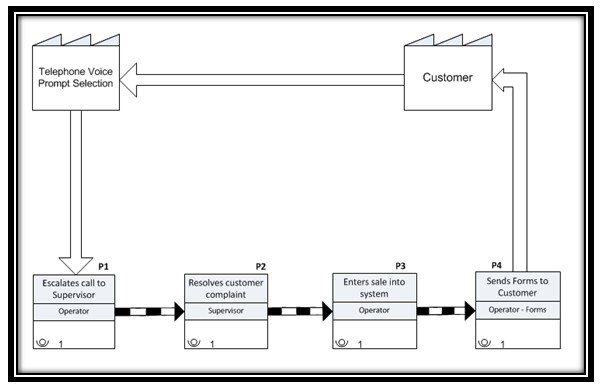
When creating a VSM, the easiest part to grasp is noting the process steps down the bottom, in order from left to right.  Before that, the customer is noted in the top right hand corner, and the supplier is noted in the top left hand corner.

Let’s take a look at something simple to start with – our first “SIPOC” step, or Lisa taking a sales call at the Shoe Emporium.

lean value stream map basic

Figure 5:  A basic start of a Value Stream Map for the Shoe Emporium sales process.  The stream “supplier” is in the top left, the steps are bottom left to right, and we ultimately deliver to the customer again in the top right, completing the cycle.

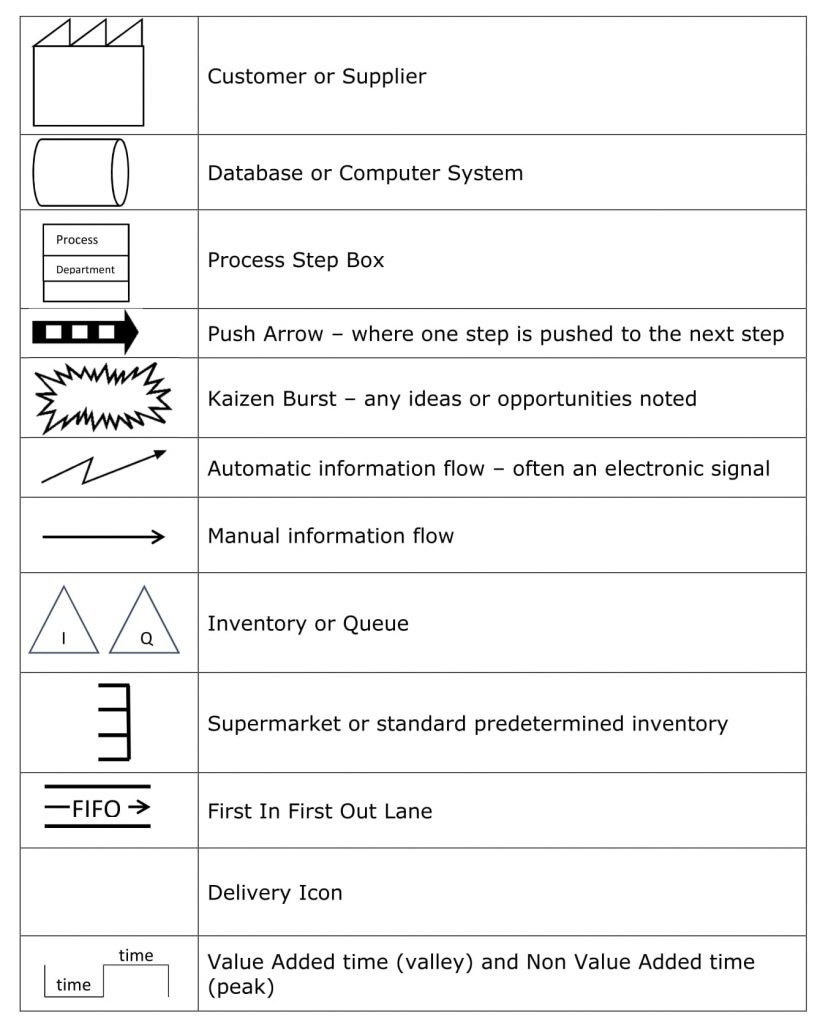
As you go through the chapters in this book all of this will make more sense to you.  Below are a few of the common icons you might come across in a Value Stream Map for you to reference as we progress.

lean value stream map icons list

Figure 6: Some of the main Icons to help show your process clearly when creating a Value Stream Map.

A picture says a thousand words, so let’s add some of these icons in where they belong, and we can see how they work in our Value Stream Map.

lean value stream map example

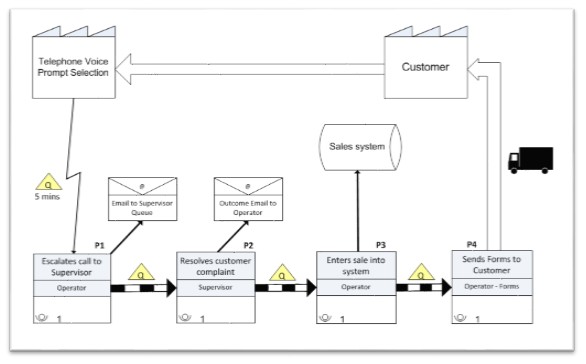
Figure 7: Our Value Stream Map with added systems, email communication, queues and delivery.  With a little experience a map like this will be second nature to you.

We now can see queues in between our processes, an email communication, an automatic transfer of information from the telephone prompt, databases or systems for where our information is stored, and a truck icon at the end, showing the delivery of the forms to our customer to end this part of the process.

Swim Lane Flow Charts

For those of you who are not yet comfortable with a Value Stream Map, another way of mapping a process is to use a Swim Lane Flow Chart.  Also known as a Business Process Map (BPM), it’s called a Swim Lane Chart because it looks like an Olympic swimming pool – but don’t be deceived by how simple it seems.  This method of mapping a process is also extremely powerful.

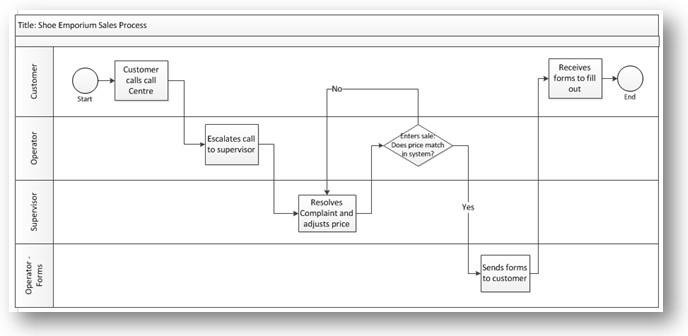
Different departments or stations are noted on the left from top to bottom with their lanes extending to the right.  It’s in these lanes that each step is noted, and the steps move up or down the lanes depending on who is performing the step.  A picture will help:

lean swimlane flowchart

Figure 8: A basic example of a swim lane flow chart, used to map our value stream.  The departments are vertical (up/down) and the process steps are horizontal (left to right).

The main difference is in the process boxes, where a square is a normal process, a diamond is a decision box (often posed as a “yes or no” question) with one or more pathways and a circle is the start or end of a value stream.

lean swimlane icons

Figure 9: The three main types of process boxes in a Swim Lane Flow Chart.  A decision process step is often posed as a “yes or no” question, with the answer influencing where the process goes from there.

You can often get a good idea of the process at a glance using this method.  It is also very easy (once you have the hang of it) to quickly jot a Swim Lane Flow Chart down on a napkin or piece of paper over a cup of coffee with front-line team-mates.  Next, we add some more information to our map so we can see any opportunities to improve at a glance.

Five Minute LeanThis is an excerpt from the book "Five Minute Lean", by David McLachlan - a wonderful book that blends teaching of the tools, culture and philosophy of traditional Lean with a modern-day Lean parable.

You can get the whole book on Amazon here and enjoy your own copy.

Selected chapters from the story within Five minute Lean:

Check out these selected chapters from the teachings within Five Minute Lean:

Five Minute Lean – Make Feedback Meaningful with Kano Analysis

Five Minute LeanThis is an excerpt from the book "Five Minute Lean", by David McLachlan - a wonderful book that blends teaching of the tools, culture and philosophy of traditional Lean with a modern-day Lean parable.

You can get the whole book on Amazon here and enjoy your own copy.

Make Feedback Meaningful with Kano Analysis

‘By discovering what delights our customers we can do more of it, by discovering what dissatisfies our customer we can fix it.’

Alternatively to the Net Promoter Score, we can ask the following two questions to discover what delights or dissatisfies our customer:

  • What did you love about your experience?
  • What did you hate about your experience?

This gives us enough information to be able to separate the answers into three sections:

  1. Delighters (things customers love, or anything mentioned with an NPS score of eight or above),
  2. Satisfiers (NPS scores between five and eight), and;
  3. Dissatisfiers (things customers hate, or NPS scores of four or below).

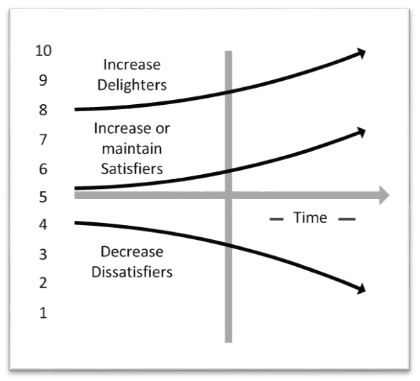
Where traditional Kano analysis focuses on basic needs, expected needs and exciting needs of the customer, quantifying customer feedback using an actual number (NPS) and broadening the scope to include things the customer dislikes gives us much more room for improvement.  The aim over time then becomes to increase the things that delight customers, continue doing the things that satisfy them and reduce the things that dissatisfy them.

lean kano analysis

Figure 1:  Slightly different to traditional Kano analysis, separating the “Voice of the Customer” into Delighters, Satisfiers, and Dissatisfiers using the Net Promoter Score results can give us more information to improve.  The aim becomes, over time, to increase Delighters, maintain or increase Satisfiers, and reduce Dissatisfiers.

You will probably notice that the answers we get in general will also fall into our three Lean “Customer Driven Metrics”, which are things that improve on Quality, Cost or Delivery times.

The next section focuses on the one most people would rather avoid – customer “Dissatisfiers” – and how we can actually use these to our advantage.

Five Minute LeanThis is an excerpt from the book "Five Minute Lean", by David McLachlan - a wonderful book that blends teaching of the tools, culture and philosophy of traditional Lean with a modern-day Lean parable.

You can get the whole book on Amazon here and enjoy your own copy.

Selected chapters from the story within Five minute Lean:

Check out these selected chapters from the teachings within Five Minute Lean:

Five Minute Lean – Implement With Agile for Fast Iterations and Feedback

Five Minute LeanThis is an excerpt from the book "Five Minute Lean", by David McLachlan - a wonderful book that blends teaching of the tools, culture and philosophy of traditional Lean with a modern-day Lean parable.

You can get the whole book on Amazon here and enjoy your own copy.

Implement With Agile for Fast Iterations and Feedback

‘Structure everything as an experiment first.  Agile is the perfect tool for releasing your change while keeping risk to a minimum.’

Agile is another methodology that can be used in conjunction with Lean to great effect, especially during implementation.  It is primarily based on releasing things in short, quick “iterations”, (implementations or experiments) to get feedback as quickly as possible.  Iterations usually last from a few days to a few weeks before feedback is gathered, changes are made and the next iteration begins.

Additionally, we also want to release the changes we make in a controlled environment as a “pilot”, where possible.  For example, making changes on one machine instead of 50 machines, or with a small group of call centre consultants instead of the full floor.

Implementing in this way has many benefits.  With no large rollout the risk is minimised.  With faster feedback we are also getting rid of opinions and cutting through to the hard data – we can see if something is working or not.  We don’t have to put a lot of time and money into it to know if it works, and it also becomes easy to see if we have affected a downstream or upstream process adversely.

In Lean terminology this method of experimenting iteratively and gathering feedback is also called “Improvement Kata”, and again relates to the “Plan, Do, Check, Act & Adjust” cycle.  Using Agile simply gives that cycle a solid framework.

Step 1: Prioritising a Backlog

The first step for the team, before an iteration begins, is to prioritise and display the work that must be completed during that iteration.

For example, team-mates would meet and write down all known and upcoming work (the “backlog”), put it in order of priority and place it on a card in the first lane of their Kanban board (below), giving them a “prioritised backlog”.  Doing this, team-mates can see what needs to be done for them to succeed.  This backlog of work may evolve as new ideas or problems come to light.

Cards for a Kanban board are usually written as a story, for example: “As a _____, I want to _____,” but they can also be in any format that is agreed within the team.  In Steve’s business, when he was improving it and making changes, he might write, “As a car cleaner, I want to have all my cleaning tools in one easy to reach location,” for one particular change.

Step 2: Using a Kanban Board

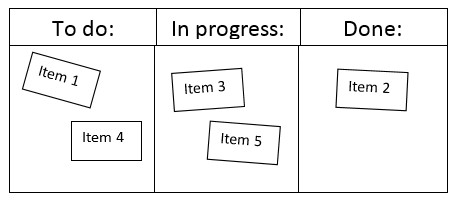
A Kanban board is used to show us at a glance the pieces of work and who they are assigned to as they move from “To Do”, “In Progress”, though to “Done”.  Remember Kanban literally means “signboard”, and a Kanban board on a wall that is easy to see is also good Visual Management (4.1).

lean kanban board

Figure 29:  An example of a Kanban Board, also good Visual Management.  This style of Kanban is often used in software development, but can also be used in implementing a Lean project or anywhere there are multiple tasks to complete.

You can have more columns if you need them, and name them to suit the phases of work or departments within your own business.  The possibilities are up to you.

Step 3: Using Stand-Ups

A “stand-up” in Agile terms is a short meeting of 5 to 15 minutes where the participants stand up, usually around a Kanban Board.  Cards on the board are updated or moved as each person speaks about the ones assigned to them and they have the opportunity to raise any issues or “blockers” that might be stopping them from completing the work.  If a blocker cannot be resolved within the short timeframe of the stand-up, then the decision is made to “take it offline”, or discuss the issue afterward and make steps to solve it.

Standing up helps keep people focused and the meetings short, and meeting regularly allows us to call out blockers close to when they first occur, so we can fix them close to the source.  This is one of the principles behind Jidoka (4.2) and also one of the capabilities of outstanding leaders, which we saw in the introduction of this book.

At the Shoe Emporium, Lisa might catch up quickly, once a day with her team-mates who are trialling new methods, to see if they are working or if they need help.

Because we are releasing in short iterations, we don’t have time for long meetings that happen once a month.  Instead, we have short meetings daily, or weekly, and we can see all the information we need at a glance using the principle of Visual Management via the Kanban Board.

Step 4: Using Retrospectives

A “retrospective” in Agile happens when we have completed an iteration.  This is where our team asks the following four questions to gain feedback on our experiment.

  1. What went well?
  2. What didn’t go well?
  3. What have we learned?
  4. What still puzzles us?

You might have many short iterations, named and numbered from one upwards, and it is great practice to stop and gather feedback during and after each one.

Knowing When it’s Time to Pivot

One of the main themes from The Lean Startup by Eric Ries is knowing when to “pivot”, or stop going down the path you are going during an implementation and pivot into a new direction, a new fix, experiment or even product.  In other words, “Adjust”-ing our course in the Plan, Do, Check, Act and Adjust cycle.

How do we know if it is not working?  If it’s not immediately obvious in the experiment we are performing then we should measure the metrics or outputs (1.2) associated with the process or the product we are changing.  As you can see, this brings us full circle as we go back to chapter one and gather feedback on whether we are meeting value as defined from our customer’s point of view.

We can also ask the retrospective questions above for feedback on our internal process, or the Net Promoter Score (1.3) questions for our external customer.

When we are satisfied with our changes in a small area, we can release it to the wider business.  And what do we do when we’ve improved our process and implemented successfully?  We can monitor it and then go through the improvement process again as we strive continually for perfection.

Five Minute LeanThis is an excerpt from the book "Five Minute Lean", by David McLachlan - a wonderful book that blends teaching of the tools, culture and philosophy of traditional Lean with a modern-day Lean parable.

You can get the whole book on Amazon here and enjoy your own copy.

Selected chapters from the story within Five minute Lean:

Check out these selected chapters from the teachings within Five Minute Lean:

Five Minute Lean – Heijunka: Level the Workload when Demand Fluctuates

Five Minute LeanThis is an excerpt from the book "Five Minute Lean", by David McLachlan - a wonderful book that blends teaching of the tools, culture and philosophy of traditional Lean with a modern-day Lean parable.

You can get the whole book on Amazon here and enjoy your own copy.

Heijunka: Level the Workload when Demand Fluctuates

‘When demand for our product or service fluctuates, we can use Load Leveling, or “predictive Pull”, to keep our workload level.’

In a perfect world, we would know in advance what our orders or requests for service might be, so that we could have enough people or resources ready.

Unfortunately, in the real world, requests often come through in different amounts and at different times, with different items being requested.  Most companies’ response to this is to either constantly be behind in orders or requests (while their customer suffers), or constantly have too much inventory or people in a desperate effort to meet demand, creating all kinds of waste (3.1).

We have already seen how to balance the Cycle times of our process with Line Balancing (3.4), but we can also balance our workload when demand fluctuates using Load Levelling, or “Heijunka”.  By using information of previous orders (or demand), combined with information of upcoming orders (or demand), we can smooth things out considerably using the following techniques.

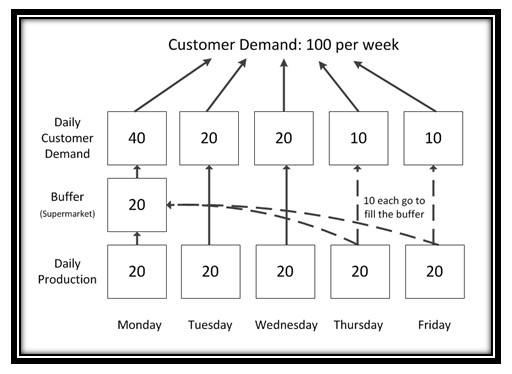
Let’s say a company regularly receives orders, for any type of item or service, for 100 items a week, but demand fluctuates from day to day (for example 40 on Monday, 20 on Tuesday, 20 on Wednesday, 10 on Thursday and 10 on Friday), we could use a small buffer of finished goods (like a Supermarket, 4.1) to respond to Monday’s high demand, then level production at 20 per day, meeting our 100 per week demand.

In Lisa’s case, if call volumes at the Shoe Emporium fluctuate from day to day, Lisa might get this information by checking the historical volumes from the last week, month and year.  She might recommend having more people working on a Monday (a buffer, like the example above) who would assist in smoothing demand.

lean load levelling heijunka

Figure 23:  An example of Load Levelling, where daily demand fluctuates.  We can use a buffer, or “supermarket” on Monday to meet demand, then smooth production at 20 per day. 

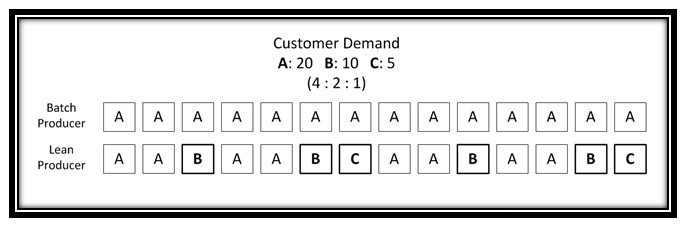
Alternatively, we can also level the type of item we work on.  Imagine a company has three types of products (products A, B and C), with daily demand being 20 for Product A, 10 for Product B and 5 for Product C, or a ratio of 4 : 2 : 1.  Instead of simply lumping (or batching) the production of each item together at the same time or with the same operator, we can level it out so there is an even number being produced at all times, allowing us to respond to fluctuating demand more readily.

lean load levelling heijunka

Figure 24:  An example of Load Levelling, where the types of requests are different.  Producing the Lean way, especially when we have one piece flow, we ensure there is an even number being produced at all times.

This is the type of thing that Lisa might use at the Shoe Emporium, if she got different types of sales and service requests by email.  Instead of only one person performing one type of request, they can be spread across her team and ensure the requests are completed evenly instead of batching them together.  This way there is less waiting while the one person completes their workload, and less chance of a single point of failure.

Five Minute LeanThis is an excerpt from the book "Five Minute Lean", by David McLachlan - a wonderful book that blends teaching of the tools, culture and philosophy of traditional Lean with a modern-day Lean parable.

You can get the whole book on Amazon here and enjoy your own copy.

Selected chapters from the story within Five minute Lean:

Check out these selected chapters from the teachings within Five Minute Lean: