All posts by David McLachlan

Five Minute Lean – Solve the Real Cause of the Problem

Five Minute LeanThis is an excerpt from the book "Five Minute Lean", by David McLachlan - a wonderful book that blends teaching of the tools, culture and philosophy of traditional Lean with a modern-day Lean parable.

You can get the whole book on Amazon here and enjoy your own copy.

Solve the Real Cause of the Problem

‘Using a Fishbone diagram and the 5 Whys is a fast and easy way to get to, and solve, the real cause of a problem.’

Implementing solutions to problems in our job or business often takes time and money to do.  Many people spend this time and money only to discover they were solving the wrong thing – addressing only the symptoms and not the actual cause.  Using the power of Root Cause Analysis can help us discover and solve the real problem and avoid this waste.  Problems are also wonderful opportunities – if we can solve the real problem it can make our job easier and far more enjoyable.

When we have a specific problem that we need to solve, it is extremely important that we:

  • Clearly define the problem we are working on, before we begin.

This means we “go and see” the problem, directly where the work is done (at the Gemba, 2.2) and hopefully as soon as it happens (with Jidoka, 4.2).

It also means articulating the problem specifically as a gap from where we are to where we want to be, based on something measurable like our customer driven metrics (Quality, Delivery, Cost or Sales, 1.2) or reducing one or more of the eight wastes (3.1).

For Lisa this might mean reducing wait time in a queue from 10 minutes (where she is) to five minutes (where she wants to be) instead of just saying “less queue time”.  Defining a problem in this way also makes it easy to know when you have succeeded – you are not chasing a vague concept.  And because you have defined the problem as a measurable gap, it is also easier to present a clear view from the problem, to a solution.

During our Kaizen meetings, while mapping our process, or even when walking the Gemba, we may need to get to the real cause of these problems we reveal.  To do so we use a Fishbone diagram and the “Five Whys”.

Fishbone or Ishikawa Analysis

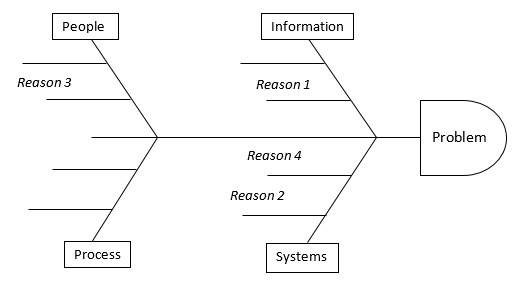
A Fishbone diagram is used to get a quick idea of where the cause of our problem might lie by separating ideas into categories.

The four categories are:

  1. People
  2. Information
  3. Process
  4. System

An easy way to remember them is “PIPS”.

In Manufacturing, the four categories can also be known as the “Four M’s”: Man and woman, Materials, Method, or Machine.

To use a Fishbone diagram, Lisa would note her clearly defined problem at one end, the “head” of the fish.  She could then have her team-mates call out reasons why they believe the problem is happening.  These reasons would be noted under any of the four categories, depending on where the cause lies.

As usual, a picture says a thousand words:
fishbone diagram

Figure 15: An example of a Fishbone or Ishikawa diagram, noting reasons under People, Information, Process and Systems.  Once complete, we can group similar problems or reasons together and then perform the Five Whys.

Once she had a few reasons, Lisa could group them together further.  For example, there might be a few reasons that relate to how people are trained, or others that always come back to a certain department.  This allows her to narrow down her causes effectively into one or two main reasons, and she can then delve even deeper with the Five Whys.

The Five Whys

Once we have an idea of where our problem lies using a Fishbone diagram, we can use the Five Whys to delve deeper into any of the main reasons that we have come up with, if we need to.

To perform the Five Whys, we ask “Why” this is happening, and with each new answer ask why again until the answers have been exhausted or we need to gather more data.

Let’s say that in one of the process steps at the Shoe Emporium Lisa identified that there is a high rework percentage, perhaps 50%.  Maybe it’s a form that doesn’t get filled out correctly and needs to be re-done.

The conversation might go a little like this:

Why does the form come back for rework 50% of the time?

 1.  The customer doesn’t fill it out correctly

Why?

2.  They don’t feel like they have to, or they don’t understand it

Why?

3.  We haven’t explained the importance of the form or how to fill it out

Why?

4.  We don’t focus on building in quality when gathering the information, and it is too easy to make a mistake.

In this scenario we didn’t need all five “whys” – this is OK.  The main point is to keep asking until the answers have been exhausted, or we need more information.  We also know our Five Whys are working when we can go back up the line of questions and replace “Why” with “Therefore”.

For example:

4.  We don’t focus on building in quality when gathering information

Therefore:

3.  We haven’t explained the importance of the form or how to fill it out

Therefore:

2.  Our customers don’t understand it

Therefore:

1.  Our customer doesn’t fill it out correctly and it comes back 50% of the time.

Once you have narrowed down your answers, you can add the real problems into your Value Stream Map as Kaizen Bursts, and brainstorm solutions with your team-mates.

When you are brainstorming solutions, you can use ideas from Chapters Three, Four and Five to help you.  This will give you tools such as having a standard process, error proofing or stopping when a defect is found, working towards one-piece flow, then changing how people are measured or rewarded and making information, process steps, queue times or other things visible, which can all have a huge impact.

It is also a good idea to use the 5 Whys on our processes – as in “Why do we do this step?”  In many cases a process may have been created long ago and things have changed or moved on, leaving the process unnecessary.  If the only reason for doing something is because “this is the way it’s always been done,” then thank goodness you are going through a Lean transformation!

Five Minute LeanThis is an excerpt from the book "Five Minute Lean", by David McLachlan - a wonderful book that blends teaching of the tools, culture and philosophy of traditional Lean with a modern-day Lean parable.

You can get the whole book on Amazon here and enjoy your own copy.

Selected chapters from the story within Five minute Lean:

Check out these selected chapters from the teachings within Five Minute Lean:

Five Minute Lean – Get Your Map Started with a SIPOC

Five Minute LeanThis is an excerpt from the book "Five Minute Lean", by David McLachlan - a wonderful book that blends teaching of the tools, culture and philosophy of traditional Lean with a modern-day Lean parable.

You can get the whole book on Amazon here and enjoy your own copy.

Get Your Map Started with a SIPOC

‘A SIPOC shows you the basic process steps, as well as your customers, requirements and handover points, all at a glance.’

One of the fastest ways to get started in mapping a process is with a SIPOC.  This kind of map gives us a very simple, high level view to help us begin.  If you want a more detailed view, you can use a Value Stream Map (2.4).

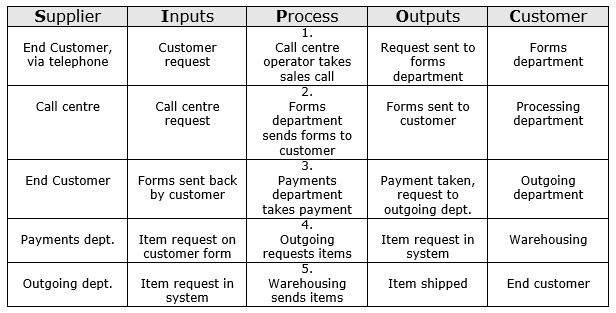
SIPOC stands for Suppliers, Inputs, Process, Outputs, and Customer.  It allows us to see the basic process flow, the suppliers and customers, and the inputs and outputs for each step.  This information can be extremely useful, for example:

  1. We can quickly see the connections between our process steps
  2. We can see what is needed to perform our steps correctly
  3. We can also manage risk efficiently, as we are seeing interacting points that might be affected by any changes we make.

In other words, when our SIPOC is filled out, we can see a large amount of information about our process at a glance.

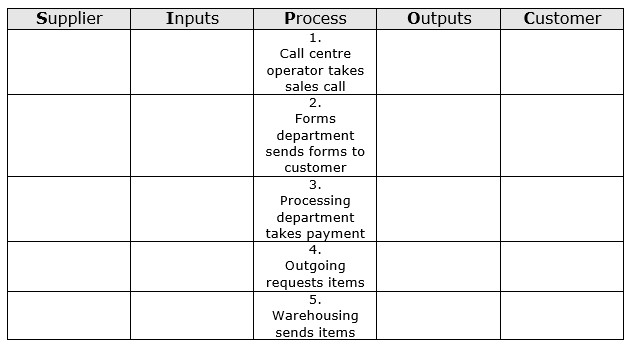
The first thing we do in our SIPOC is a high level process flow – the main steps we perform to create our product or service.  For the sake of continuity, let’s use the process flow from the Shoe Emporium in our story:

SIPOC example

Figure 3:  The basic process flow outlined in our SIPOC, based on the Shoe Emporium sales process.

In a SIPOC we are describing only the main steps – as you would if you were telling someone you just met at a barbeque, about your job.  Once we have a high level process flow, we can add the Supplier, Input, Output and Customer for each step as well.  Remember – our Supplier can be any step before the current one, and our Customer can be any step after our current one.

SIPOC example

Figure 4:  Our SIPOC with the additional information included so we can see our inputs and outputs at a glance.

We can also add “Customer Requirements” (which are the required outputs of the process), and “Measures”, or how the process is measured so we know when it is successful or completed.  This additional information is also very useful, and would make our diagram a SIPOCr+M.

Now that we have a high level view of our process, we discover problems in our work with a Value Stream Map.

Five Minute LeanThis is an excerpt from the book "Five Minute Lean", by David McLachlan - a wonderful book that blends teaching of the tools, culture and philosophy of traditional Lean with a modern-day Lean parable.

You can get the whole book on Amazon here and enjoy your own copy.

Selected chapters from the story within Five minute Lean:

Check out these selected chapters from the teachings within Five Minute Lean:

Five Minute Lean – Collect and Measure Feedback With the Net Promoter Score

Five Minute LeanThis is an excerpt from the book "Five Minute Lean", by David McLachlan - a wonderful book that blends teaching of the tools, culture and philosophy of traditional Lean with a modern-day Lean parable.

You can get the whole book on Amazon here and enjoy your own copy.

Collect and Measure Feedback With the Net Promoter Score

‘The Net Promoter Score is a great way to discover and measure customer value.’

The Net Promoter Score (NPS) was outlined in a book called “The Ultimate Question 2.0” and is a great way to determine customer feedback and what they truly value.

It is a simple question we can ask when we want to gather direct feedback, typically after the product or service has been delivered.

1.  On a scale of one to 10 how likely would you be to recommend us to a friend?

Let’s say a customer says a “six”.  The next question works both because of its simplicity and its results:

2.  What would it take to make it a 10?

When a customer answers this question for us, it prompts them to give more detail on what would bring them enough value to compel them to recommend our services.  This question can be used in a survey, or as a follow up call to the customer to ensure we try and fix the problem straight away.

Using the NPS in this way is a great start in finding out what delights and what dissatisfies our customer, which brings us to Kano Analysis in our next section.

Five Minute LeanThis is an excerpt from the book "Five Minute Lean", by David McLachlan - a wonderful book that blends teaching of the tools, culture and philosophy of traditional Lean with a modern-day Lean parable.

You can get the whole book on Amazon here and enjoy your own copy.

Selected chapters from the story within Five minute Lean:

Check out these selected chapters from the teachings within Five Minute Lean:

Five Minute Lean – Present and Manage Your Change Using an A3 and LCA
Five Minute LeanThis is an excerpt from the book "Five Minute Lean", by David McLachlan - a wonderful book that blends teaching of the tools, culture and philosophy of traditional Lean with a modern-day Lean parable.

You can get the whole book on Amazon here and enjoy your own copy.

Present and Manage Your Change Using an A3 and LCA
‘With an A3 “one-pager” you can see your entire project at a glance, with an LCA Board you can see your change’s impact on frontline metrics at a glance, and with an Action Register you can keep everyone involved and accountable.’

Remember Visual Management (4.1)?  As well as being something we can use in a process (like Jidoka so we can see if a process is broken, a Kanban to trigger work or even organising with 5S) we can use Visual Management for our project and metrics.  It all comes back to the question: “What information would be really useful to see at glance?”

Using an A3

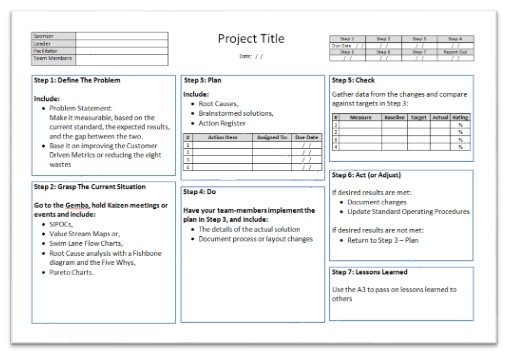
An A3 is a “one-pager” that shows us the details of the Lean implementation quickly and simply – usually following the Seven Step Problem Solving process and with the following information:

  1. The team and timeline (including stakeholders and facilitator)
  2. Defining the problem
  3. Analysis of the current situation
  4. Root causes and proposed solutions
  5. The action plan
  6. Measuring the results against the baseline
  7. The new standard procedure

Another way to put it is in the form of the most recognised Lean cycle – Plan, Do, Check, Act (and Adjust), as you can see in the example below.  A good reason to start filling out your A3 straight away, is because the first step is “Define the problem” (3.3).  Many people try to solve things without really knowing what the problem is – filling out an A3 first helps avoid this.  You can then include things like your Value Stream Maps, any data collected, and root causes and countermeasures in your A3 as you progress.

Lean A3

Figure 26: An example of an “A3”, where you can see the details of your project at a glance, all on one page.  An A3 template is included at the end of this book.

Another reason to start an A3 as soon as you begin, is that it helps you take your team-mates on the journey with you, and build their problem solving skills as well.  They can see the steps outlined clearly in advance, and the techniques the team has used along the way.

Lisa would use an A3 to showcase the details of her change to others (like Michael Pilbury), and help take her team on the journey as they progress, passing on the tools and methods.

Using an Action Register

It is essential in any company to put the details of who will action each item during the implementation.  This is where an Action Register can come in handy, detailing changes, timeframes and who is responsible for getting them done.  We should also include a “measure” of the item – with the existing data and the target data after the change is complete.

Lean Action Register

Figure 27: An example of an action register.  It is wise to assign action items, give them a due date, and make them measurable (Figure 28).

Lean Measures Table

Figure 28: An example of a measures table that can be included with any actionable items, or in your “A3”.

Giving team-mates responsibility for action items will help bring them on board for the change, and including a due date for completion will help keep everyone accountable.

Using a Layered Check Act (LCA) Board

A Layered Check Act board, on the other hand, is designed to display how a process is running.  It will usually be at least one to two meters in length, and it shows the metrics of a current process measured against the proposed targets.  This is great for seeing whether or not you are on the right track in your work.  If the metrics are not meeting the proposed targets, then countermeasures are added, using Lean tools and methods, to assist in bringing them into line.  For this reason, and as we come full circle, it is often a good idea to use an LCA board at the beginning of a Lean transformation, so you can see how you are tracking.

What metrics should we put on our LCA board?  Ones that relate to our customer, such as Quality, Delivery or Cost, as described in (1.2).  First Pass Yield, or Pareto charts on defect types are important metrics that relate to Quality. Lead time, Cycle times and Takt time relate to Delivery, and everything ultimately comes back to Cost.

There may also be internal things specific to your company that management wants to measure, such as having a standard process clearly visible for each step or station placed on your board.  Remember, what you measure, tends to improve (5.5).

Five Minute LeanThis is an excerpt from the book "Five Minute Lean", by David McLachlan - a wonderful book that blends teaching of the tools, culture and philosophy of traditional Lean with a modern-day Lean parable.

You can get the whole book on Amazon here and enjoy your own copy.

Selected chapters from the story within Five minute Lean:

Check out these selected chapters from the teachings within Five Minute Lean:

Five Minute Lean – Build in Quality with Error-Proofing and Autonomation

Five Minute LeanThis is an excerpt from the book "Five Minute Lean", by David McLachlan - a wonderful book that blends teaching of the tools, culture and philosophy of traditional Lean with a modern-day Lean parable.

You can get the whole book on Amazon here and enjoy your own copy.

Build in Quality with Error-Proofing and Autonomation

‘By making it close to impossible to make a mistake, and making it easy to stop when something is wrong, we can save ourselves many hours in rework and many dollars of waste.’

Using Error-Proofing

Poke Yoke is a Japanese term for “error proofing”.  The idea is to build in quality by providing constraints to prevent incorrect use, making it close to impossible to make a mistake.

An example of this would be a USB cable – you can only plug a USB cable into a USB port – nothing else will fit.  It’s mistake proof!  This is Poka-Yoke.  Another example would be the fact that many cars are unable to start if they are already in gear, or a form with specific drop-down menus so the user choice is limited, avoiding errors.

The question we ask ourselves for Poka-Yoke is:

  • How do we provide constraints to prevent incorrect use in this product or process?

Lean Error Proofing

Figure 22:  An example of error proofing, where plugs around the home or workplace can only fit into the socket they are meant for.

Using Autonomation

Autonomation or “Jidoka” in Japanese, means providing both team-mates and machines with the ability to detect when something is wrong and immediately stop work so they are not passing on defects to the customer.

Doing this also highlights any problems in a process, because work stops when a problem first occurs.  By stopping when a problem first occurs, we can get a consensus on the root cause of the problem (3.3) before we try and solve it.  Then we can put a quick fix in place at first to keep the process moving, and work on a long term fix directly afterwards.

Using an Andon, which is a light that shows the status of a process or operation (such as green for go, red for stop) is one way to use Jidoka.

The questions we ask ourselves for Autonomation or Jidoka are:

  • How do we know when something is wrong?
  • What is the visual signal we would like to see when this happens?

This step is an extremely important part of our ability to make problems visible (4.1) at the Gemba – Jidoka must be a part of each step in our process so defects are never passed through.

It is also one of the main principles of Lean that we “solve problems close in person, place and time”, as they happen.  To give you an example, let’s think back to the Net Promoter Score in (1.3).  If our customer gives us a six out of ten or lower, and we arrange to get this information straight away, we might call them to sort out any problem they might have right then and there, instead of letting it get lost in the system or losing valuable information from the source.

Implementing Jidoka with a Zero Tolerance for Rework

Jidoka is not just about stopping when we have a defect.  At its core it is also about having a zero tolerance for defects and rework.

Before you implement Jidoka in your workplace, an easy way to begin is to have your team-mates set aside any item that comes to them requiring rework, and not work on it at all.  Then, at the end of the shift, collect all the unfinished items and note down the different “defect” types.  You can do a Pareto Analysis (3.2) to see which defect types are the most common, find out why they occur with root cause analysis (3.3), make errors visible if possible (4.1) and stop work if they ever happen again so you can fix them close to the source.  This is Jidoka.

Add any Poke Yoke or Jidoka ideas that fit with your space to your current state Value Stream Map, as a Kaizen burst (2.5).

Five Minute LeanThis is an excerpt from the book "Five Minute Lean", by David McLachlan - a wonderful book that blends teaching of the tools, culture and philosophy of traditional Lean with a modern-day Lean parable.

You can get the whole book on Amazon here and enjoy your own copy.

Check out these selected chapters from the teachings within Five Minute Lean:

Selected chapters from the story within Five minute Lean:

Five Minute Lean – Use Pareto to Find Where to Start

Five Minute LeanThis is an excerpt from the book "Five Minute Lean", by David McLachlan - a wonderful book that blends teaching of the tools, culture and philosophy of traditional Lean with a modern-day Lean parable.

You can get the whole book on Amazon here and enjoy your own copy.

Use Pareto to Find Where to Start

‘The 80/20 rule states that 80 percent of our problems or opportunities come from 20 percent of the inputs. A Pareto chart makes it easy to see where our best opportunities are.’

In some cases we might have a few different problems to choose from when improving our job or business.  When there is more than one option it can be a good idea to discover the area that will give us the most value for our effort and start there.

Pareto Analysis or the “80/20 Rule” is a tool that can help us discover this, and quickly.  The theory is that 80% of our results often come from 20% of our effort.  This is the kind of thing Steve might point out at the boardwalk, where a restaurant might make 80% of its profits from just 20% of its menu.  For Lisa it might be that the Call Centre loses 80% of customers waiting in queue because one of the five voice menu options sends them to the wrong place.

The amounts don’t have to be exactly 80/20, but you will usually find one or two stand out processes or problems that can give you a larger return on your effort if you focus on it first.

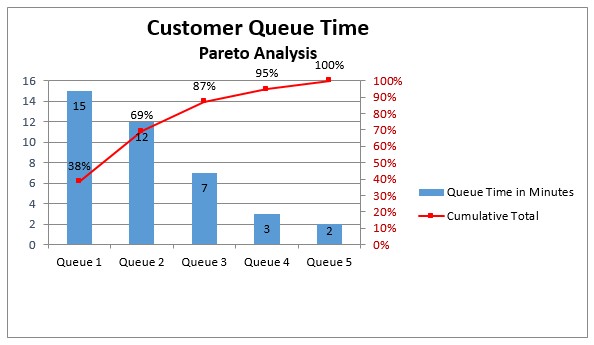
A Pareto Chart is a bar chart of whatever we are measuring – whether they are queue times, number of requests, sales figures, defects or mistakes.  This bar chart is sorted from largest to smallest, and a line chart is then placed over the top of it showing the cumulative percentage as it grows from 0% of the results to 100%.  In this way we can see where our larger opportunities are (such as in the first two queues in Figure 14) as they make up the majority of around 70% of the total time, and we can focus on these first.

Figure 14:  An example of Pareto Analysis.  Queue 1 and Queue 2 have the longest times and combined they make up around 70% of the total – the ‘significant many’.  We can see that it might be valuable to start working on Queue 1 and 2 processes first.

By using a Pareto Chart, we can focus on where our biggest impacts might be.  It is a tool that can be used for almost any input or when making a decision on where to start.

Five Minute LeanThis is an excerpt from the book "Five Minute Lean", by David McLachlan - a wonderful book that blends teaching of the tools, culture and philosophy of traditional Lean with a modern-day Lean parable.

You can get the whole book on Amazon here and enjoy your own copy.

Selected chapters from the story within Five minute Lean:

Check out these selected chapters from the teachings within Five Minute Lean:

Five Minute Lean – Use Kaizen and Kaizen Events to Help Stakeholder Buy-In

Five Minute LeanThis is an excerpt from the book "Five Minute Lean", by David McLachlan - a wonderful book that blends teaching of the tools, culture and philosophy of traditional Lean with a modern-day Lean parable.

You can get the whole book on Amazon here and enjoy your own copy.

Use Kaizen and Kaizen Events to Help Stakeholder Buy-In

‘Kaizen, and Improvement Events get the right people involved all at once, to properly define the problem and map the path to a solution using Lean tools.’

The term “Kaizen” is Japanese for improvement, or continuous improvement.

A Kaizen Event, therefore, means an “improvement meeting”.  It often involves a few front-line staff from the process involved, a few people who are not familiar with the process to get an outside perspective, and sometimes a few people from the leadership team.  Your team use any of the tools they need to from this book, to reveal problems, discover opportunities and make a solid case for change.

If everyone is already familiar with the concepts (and with a book like this in everyone’s hands, they should be), then it is much easier to get everything down on paper quickly.  It could be started over a cup of coffee with someone involved in the process, or integrated into an existing regular weekly meeting with a team of front-line staff.

Ensuring front-line team-mates and leaders are involved with your Kaizen events will also help you get one of the most important and often the most elusive things: stakeholder buy-in.  The more input someone has into something, the more likely they are to support it.  As you take them through the steps, you are not only building their skill-set, but helping them be a real part of the solution.

This is why Steve was so insistent on Lisa getting her team-mates involved when starting with her current state map.

By itself, Kaizen or continuous improvement should be a regular part of your week, including “every person, every day” in stopping when there are problems (4.2), defining them using the customer driven metrics (1.2), getting to the real cause of the problem (3.3), and checking ideas to fix them.  Even small ideas that warrant a “just do it” test (easily done using Agile, 5.3) to quickly see if they work, can get things underway.

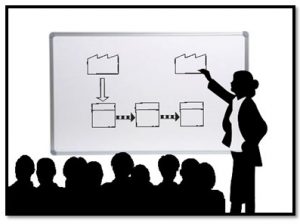
Figure 2: A Lean practitioner leading a Kaizen Event, involving people who do the process every day.

Five Minute LeanThis is an excerpt from the book "Five Minute Lean", by David McLachlan - a wonderful book that blends teaching of the tools, culture and philosophy of traditional Lean with a modern-day Lean parable.

You can get the whole book on Amazon here and enjoy your own copy.

Selected chapters from the story within Five minute Lean:

Check out these selected chapters from the teachings within Five Minute Lean:

Five Minute Lean – Gather Direct Feedback and Indirect Feedback

Five Minute LeanThis is an excerpt from the book "Five Minute Lean", by David McLachlan - a wonderful book that blends teaching of the tools, culture and philosophy of traditional Lean with a modern-day Lean parable.

You can get the whole book on Amazon here and enjoy your own copy.

Gather Direct Feedback and Indirect Feedback

‘By gathering feedback from our customer we can provide the value that they are willing to pay for.’

If the product is something that brings value to the customer, how do we find out what value actually means to them?

We need to gather feedback, both directly from the customer by asking, and indirectly in the form of measuring results.

Indirect Feedback – Measuring Customer Results

In Lean, there are certain results, called the “Customer Driven Metrics”, which can show us whether a process is working well or not, and also help us clearly define any problem before we begin (3.3).  Almost every improvement opportunity within a business can be defined using these metrics, as they are centred on our most important participant, the customer.

They are:

1.  Quality

An increase in the quality of the product or service (or reduction in defects or rework)

2.  Delivery

Making the delivery faster, or better suited to the customer, including faster “delivery” between each process (or improving timings such as Cycle time and Lead time in 2.5).

3.  Cost

A decrease in the cost of creating the product or service, which is ultimately related to Quality and Delivery as well.

Of course, Quality, Delivery and Cost are not the only things that can be can measured.  Another great way to see whether a product is providing the right value to the customer is to gather feedback on the metrics below:

1.  Sales

When there is a product, even a Minimum Viable Product for a start-up company, we can measure the sales of the product as we change or add features to it.  In this case, the more sales the better.

2.  Returns

While not traditionally considered a good thing, if a product is being returned this is still feedback that we can use, and can also be a good opportunity for us to ask our customer more about what brings them value.

3.  Customer Complaints

Complaints are the perfect way to measure if a product is performing well.  Obviously, the fewer the better.  They are also a goldmine for Lean initiatives because where there is a complaint, there is an opportunity to improve, so we should collect complaints and use them wisely.

Direct Feedback – Asking Our Customer

Alternatively, the most straight forward way to get feedback from a customer is to ask.  And typically the best time to ask a customer for feedback is after they have bought the product or service and the experience is fresh in their minds – for example when Lisa has been through a sales call with one of her customers.

Depending on the situation, we can use:

  1. Asking face to face
  2. Telephone follow-up calls
  3. Email follow-ups
  4. Customer surveys
  5. An online question box
  6. A feedback slip to collect or place in a box

Sections 1.3, 1.4 and 1.5 go into more detail as to what to specifically ask your customers, and how to manage the results you get.

Five Minute LeanThis is an excerpt from the book "Five Minute Lean", by David McLachlan - a wonderful book that blends teaching of the tools, culture and philosophy of traditional Lean with a modern-day Lean parable.

You can get the whole book on Amazon here and enjoy your own copy.

Selected chapters from the story within Five minute Lean:

Check out these selected chapters from the teachings within Five Minute Lean:

Five Minute Lean – Create a Future State Value Stream Map

Five Minute LeanThis is an excerpt from the book "Five Minute Lean", by David McLachlan - a wonderful book that blends teaching of the tools, culture and philosophy of traditional Lean with a modern-day Lean parable.

You can get the whole book on Amazon here and enjoy your own copy.

Create a Future State Value Stream Map

‘When you can see a possible future next to a current reality you can see at a glance if your change is worthwhile.’

Seeing the possible changes that can be made side by side with an existing process is one of the most eye-opening experiences ever.  As a manager or business owner it is possible to lose touch with the ground-level processes, and seeing improvements mapped out clearly can be extremely valuable.

This step is called “Perfection” at the Lean Enterprise Institute, simply because when we are continually improving, testing changes and streamlining processes, then our aim of perfection becomes much more achievable.

Going through the steps so far, we have a Current State Value Stream Map that shows us our wastes, queues, rework and more.  Once we have been through the process of brainstorming ideas for eliminating waste and increasing value, we need to show what it would look like in a Future State Value Stream Map and present it to the appropriate decision makers.

This is the kind of tool that Lisa can use to build a case and help management or stakeholders buy in to the change.

Have any existing processes been taken out?  Have we taken out queues or combined two systems into one?  Have we performed Line Balancing?  Have we added in Supermarkets, FIFO, Error Proofing, Visual Management or new Kanban triggers?  All of these will change the Value Stream Map, and now it’s time to show the effects.  We should ensure that our new reduced timings are included, including our new Value Add times versus Non Value Add times and the new total Lead time.

Presenting a change in this way ensures professional results, using solid data and facts to support them.  An “A3” can also help your presentation, which we discuss in (5.2).

Five Minute LeanThis is an excerpt from the book "Five Minute Lean", by David McLachlan - a wonderful book that blends teaching of the tools, culture and philosophy of traditional Lean with a modern-day Lean parable.

You can get the whole book on Amazon here and enjoy your own copy.

Selected chapters from the story within Five minute Lean:

Check out these selected chapters from the teachings within Five Minute Lean:

Five Minute Lean – Create a Pull System with FIFO, Kanban Triggers and Visual Management

Five Minute LeanThis is an excerpt from the book "Five Minute Lean", by David McLachlan - a wonderful book that blends teaching of the tools, culture and philosophy of traditional Lean with a modern-day Lean parable.

You can get the whole book on Amazon here and enjoy your own copy.

Create a Pull System with FIFO, Kanban Triggers and Visual Management

‘By making our process visible, including visual triggers and a small standard inventory where necessary, we can create our product or service as our customer orders it, instead of working to create something that no one wants.’

We know that our customer can be our end customer or anyone who is next in the process (downstream) from our department or process.  In this part of our Lean journey we will start doing things to get rid of work piling up and being forced on us or our downstream customers.

At the Lean Enterprise Institute, this fourth step is simply called “Pull”, and the idea is to create a Pull system as opposed to a Push system.  What this means is that you or your department creates a product or service only as your customer (or downstream process) requests, or “Pulls” it.  We don’t “Push” our product to our downstream process or customer, or we don’t create product unless it is asked for.

This has the effect of reducing large inventory of unnecessary items, reducing “work in process” or a build-up of unfinished work, streamlining the process and promoting one piece flow (3.5).  This in turn improves upon our customer driven metrics of Quality, Delivery and Cost.

Many of the tools below will assist in promoting a Pull system, and fit nicely with the methods we’ve already learned.

FIFO Lane

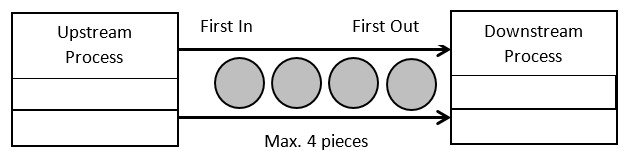
FIFO stands for First in First out, and it is an outstanding way to make sure that stock doesn’t go out of date, or that work is distributed fairly.  It is most commonly used in a “FIFO Lane” where items in a lane are taken at one end and supplied from the other.

Lean - FIFO Lane

Figure 19:  An example of First In First Out – a small amount of inventory that takes the oldest first. 

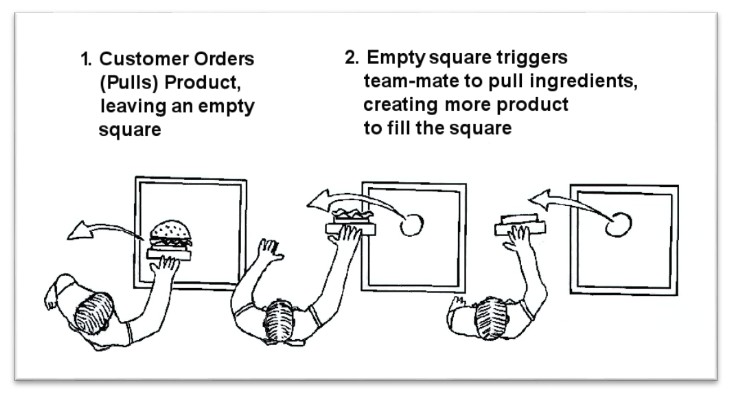
You will have seen this in the bread aisle in your local supermarket – you take, or “Pull” bread from the bottom as you need it, and they restock it from the top.  Of course, this is the best way to avoid stale old bread!  But it might also be how you delegate work.  It might be how you replenish perishable medicines.  It might be the order in which you prepare food in after taking a customer’s request in a drive-through.  The main idea is that the item is pulled only as it is needed, and an empty space in the FIFO lane triggers the need for the item to be replaced.

Not every job will be able to create their product or process from scratch as quickly as a customer orders it.  A bakery still has to bake their goods, and a hotel still has to prepare their rooms, for example.  This is why keeping a small amount of “inventory” handy in any process via a FIFO Lane or Supermarket (below) can assist you in delivering quickly, without overproducing.

Supermarket

Another similar theme to FIFO is the Lean “Supermarket”.  A Supermarket is a predetermined standard inventory that is kept to supply the downstream process in exact amounts.

For example, if a doctor used 10 vials of medicine at a time in one operation, we might keep 10 of that particular medicine in one place so the doctor could take that exact amount for each operation.  When that box is taken it will leave an empty space, triggering us to replace it with another pre-made box of 10.

Figure 20:  A basic Pull system, where the customer pulls (orders) the product, and the empty squares prompt our team-mates to pull ingredients from their upstream supplier and create another product for the customer.

Kanban Trigger

Kanban is a Japanese term for “sign” or “signboard” and is basically a signalling system to trigger action.  In other words, we ask ourselves:

  • How do we know when we need to begin work on an item?

And:

  • How do we let our supplier know we are pulling work (or product) so they can replenish or create their product as necessary?

What is the trigger that tells us these things?  This is where a Kanban comes in.

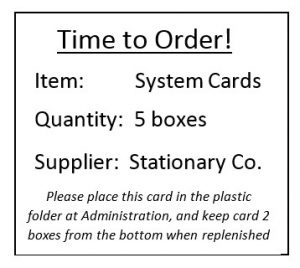
Traditionally Kanban was associated with a “Kanban card”, which was a card (or small “sign”) holding details such as the product and quantity required of a product, handed to the upstream supplier to trigger production.

In a company using Agile techniques (5.3) it might be items in a Kanban “To Do” lane waiting on their wall.  Ask yourself what the trigger is, or if you don’t have one, what trigger would work best for you?  In other industries, a Kanban can simply be any trigger to begin working on an item.  It might be a green light telling us “ready to go!”, it might be an “ORDER MORE” or “REPLACE” card placed where there are two left of something in stock, it might be an empty slot in a FIFO lane or an empty space (specially allocated by Five S in 4.4) for our Supermarket.

Figure 21:  A simple Kanban card, with standard instructions and quantities included. 

Visual Management

Visual management is another Lean method that can be applied to industries of all types.  The idea is to increase transparency by making your process “visible”.  Things that are visible tend to get noticed, and things that are visible tend to get done.  This can include detail of work queues, anything blocking the flow of the process, who is doing what or sizes of jobs; the list goes on and really depends on your industry or workplace.

For this step we ask ourselves:

  • What information would be really useful to see at a glance, so we can know if things are working as they should?

Then we can go about putting this on one board, signal or sheet of paper for all to see.  A Layered Check Act board (5.2) that shows process metrics is a good example of visual management.  It could also be instructions for a process step made clearly visible at the work station with Five S (4.4).  The Kanban board or Kanban card we mentioned earlier is also an example of visual management.

Visual Management is something that Lisa might use, if she wanted to make her sales calls visible.  It is not uncommon for a call centre to have a large electronic board with the amount of people waiting, or the amount of people available to take calls.

If you come up with any ideas for visual management during your Kaizen meeting, add them to your current Value Stream Map as a Kaizen burst (2.5) so you can remember them for later.

Five Minute LeanThis is an excerpt from the book "Five Minute Lean", by David McLachlan - a wonderful book that blends teaching of the tools, culture and philosophy of traditional Lean with a modern-day Lean parable.

You can get the whole book on Amazon here and enjoy your own copy.

Selected chapters from the story within Five minute Lean:

Check out these selected chapters from the teachings within Five Minute Lean: