A Lean A3 is a project summary on a page. It tells the story of your change, improvement or project from the time it is just an idea all the way through to delivery and implementing the change. It also shows the main people involved, the data and reasons for the improvement, and a high level schedule for making the improvement.
It follows the “Deming Cycle”, of Plan, Do, Check, and Act (or Adjust). Check out the video to create your own PDCA Lean A3 in PowerPoint below!
Step 1
First create the heading area, by Inserting a Square shape, and colouring it grey.
Place two tables over the heading area, both without a “header” and unchecking banded rows. Turn these into our people and schedule list.
Step Two
Create seven more squares underneath this as our plank PDCA template,which will include the seven problem solving steps of a Lean PDCA A3. These are:
Define the problem
Grasp the current situation
Plan
Do
Check
Act (or Adjust)
Lessons Learned
Step 3
Now we can fill in the Lean A3. For each step:
Gather data and the “Gap” between where you are and where you want to be
Use Value Stream Maps, process maps, Pareto charts, Fishbone diagrams to grasp the current situation and potential root causes
Create an action plan based on the root causes, assign actions to people and give due dates.
Show the schedules and actions in progress using a Gantt chart or Kanban board.
Check your measures – what were you aiming for, and what was achieved?
Update the Standard Operation Process (SOP) with the new process
Perform a project Post-mortem, Retrospective, and gather lessons from the project.
Well done for improving your knowledge on Project Management! If you want to see the “Key Concepts & Tools” for Project Risk Management, click here. Enjoy!
Below you will find videos on all the Project Communications Management sections from the PMBOK Guide.
If you want to see the “Key Concepts & Tools” for Project Communications Management, click here. Enjoy!
Project Communications Management Overview
Plan Communication Management
Manage Communications
Monitor Communication
Well done for improving your knowledge on Project Management! If you want to see the “Key Concepts & Tools” for Project Communications Management, click here. Enjoy!
Well done for improving your knowledge on Project Management! If you want to see the “Key Concepts & Tools” for Project Cost Management, click here. Enjoy!
Below you will find videos on all the Project Schedule Management sections from the PMBOK Guide.
If you want to see the “Key Concepts & Tools” for Project Schedule Management, click here. Enjoy!
Project Schedule Management – Overview
Plan Schedule Management
Define Activities
Sequence Activities
Estimate Activity Durations
Develop Schedule
Control Schedule
Well done for improving your knowledge on Project Management! If you want to see the “Key Concepts & Tools” for Project Schedule Management, click here. Enjoy!
Below you will find videos on all the Project Integration Management sections from the PMBOK Guide.
If you want to see the “Key Concepts & Tools” for Project Integration Management, click here. Enjoy!
01 – Project Integration Management
Overview
Develop Project Charter
Develop Project Management Plan
Direct and Manage the Project Work
Manage Project Knowledge
Monitor and Control Project Work
Perform Change Control
Close Project or Phase
Well done for improving your knowledge on Project Management! If you want to see the “Key Concepts & Tools” for Project Integration Management, click here. Enjoy!
What happens if we want to compress our schedule? Maybe it’s going to take a long time and we want to make it shorter – that’s where schedule compression techniques come into play.
Schedule compression is a technique that’s used to shorten or accelerate the schedule duration without reducing the project scope. We still want to deliver what we are delivering – that business value as part of our project – but we might have certain schedule constraints, imposed dates that we need to meet or other schedule objectives. So we need to compress that schedule.
There are two main compression techniques that you’ll see on the PMP exam and in the Project Management Body of Knowledge, and even in your project management career. Those two are “crashing” the schedule, which shortens the schedule duration by adding resources. That can be very costly as we’re adding more people or things. The other one we’re looking at is fast tracking, where activities or phases normally done in sequence are now performed in parallel or at the same time for at least a portion of their duration. That way we’re able to cut back on the time frame.
Let’s look at a few examples.
Crashing might involve approving over-time, adding resources, paying to expedite the delivery of activities on the critical path. Of course because of that crashing may result in increased risk, and certainly an increased cost.
As an example up the top here we’ve got Task 1, Task 2, Task 3 as our normal schedule with just one person assigned to each. But if we’re crashing this project schedule we’re adding resources to it, so now all of a sudden we’ve got a lot more resources there and we’re able to shorten the time of that task.
You have to be aware of the law of diminishing returns here, where sometimes adding more and more people -your return on that investment will get less and less over time. Sometimes adding more people isn’t the answer. But in this case, when we’re crashing a project we’re looking for that to be the answer to reduce our project schedule.
The other one is fast tracking, where we’re performing tasks in parallel. Again this might result in rework and an increased risk and cost, and it only works when activities can be overlapped to happen at the same time, to shorten the project duration on the critical path. We’re using the lead time, if there’s any lead time that we can take up we’re using that to perform those tasks in parallel. For example one, two, three in sequence but now one, two, three we’re performing some of these activities at the same time by fast tracking our project. Because we’re able to do that we don’t have to add more resources in this case, so the cost is a little bit less than if we were to crash the project with project resources. And that is the idea of schedule compression, crashing your schedule and fast tracking your schedule.
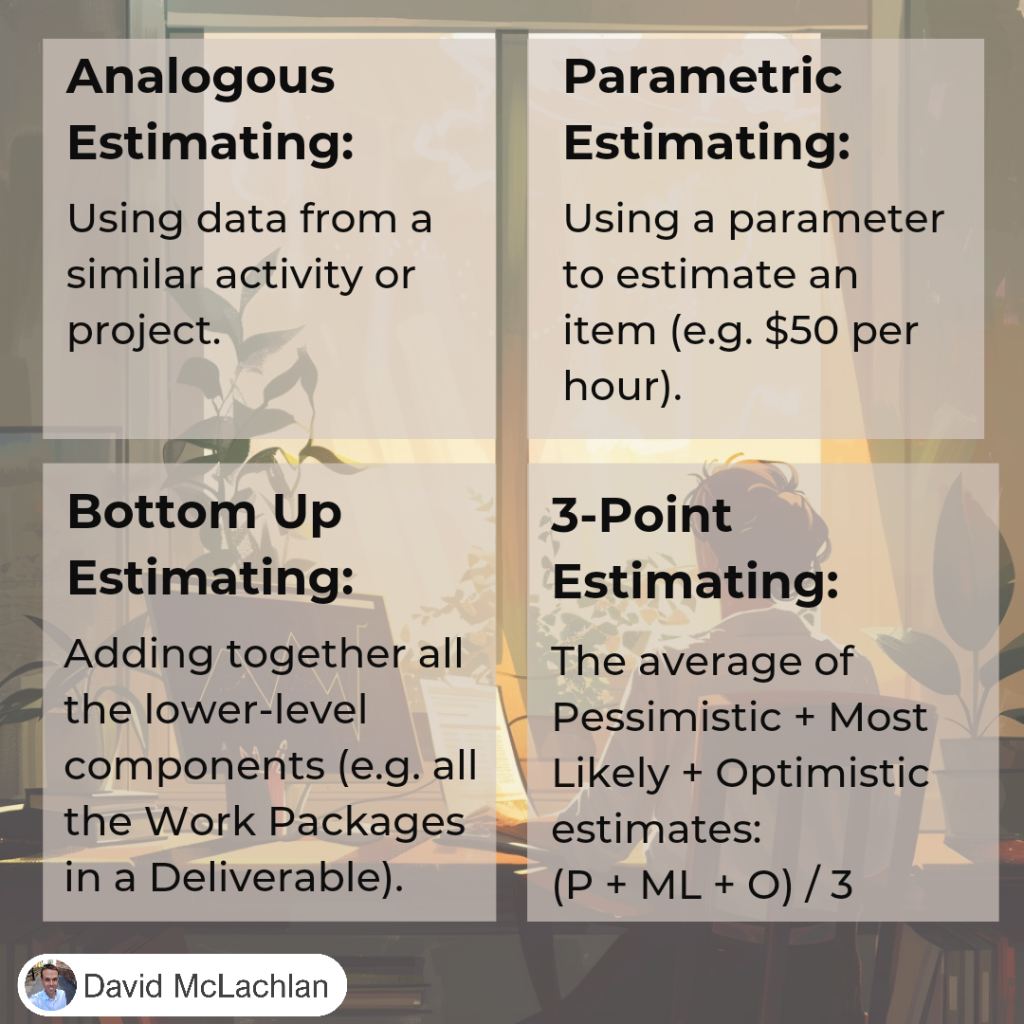
You will definitely see project estimating techniques mentioned as part of the PMP exam, so it’s good to know the four main different types and the differences between them.
Throughout your project you’ll be asked to make those estimations of future performance, and that could be in your Schedule, it could be in the Cost of the project, it could even be in the quality of your project. The four main methods that you will come across as part of the PMBOK guide are:
Parametric estimating
Bottom up estimating
Analogous estimating, and;
3-point estimating.
They might sound a little bit funny at first, so let’s go into them in more detail.
First of all we’ve got parametric estimating. This is where we’re actually using a parameter to estimate per item. So it’s a simple parameter, for example 55 meters or $55 per square meter or square foot. We might have a thousand dollars per roll of metal, or twenty days per delivery in our schedule for example, where it might take to get something to another country. We might be looking at two-week sprints per each feature that we’re delivering in a software project, or a team might take an eight-hour workshop to complete a risk assessment. All of these are parameters that we might assign to the activities so that we can estimate for those activities.
Next up we’ve got bottom up estimating. This is where we’re estimating project resources by assigning a value to the lower-level components of the Work Breakdown Structure. We’re starting from the bottom and we’re working our way up. And when we say the bottom we mean the the lower level tasks that have been assigned to our teams. Now these of course go up in the work breakdown structure to the larger tasks or features, and then to an overall delivered feature (and this is where we start getting into Agile potentially or Feature Driven Development) but the idea of that is that this team can estimate on their piece of work, this team can estimate on their piece of work or their single task or one or two tasks, and that might be say $10,000, this one might be $20,000, this one might be $5,000, and then we take all of those items and we bring them up into the feature so the total there could be $50,000 and then the total for the overall feature could be $100,000 for example. But the key is that we’re starting at the very lowest level of the activity, we’re starting from the bottom.
Next up we have Analogous estimating. This is where we’re finding an analogy, something similar to what we’re currently doing. We’re estimating the duration or cost of an activity or a project using historical data from a similar activity or a similar project. Of course this is frequently used to estimate project duration when there is a limited amount of detailed information, so we haven’t gotten down into the Work Breakdown Structure yet at the team level, we only have a really high-level idea. Using Analogous Estimating we can get a rough idea of how much it will cost, or how long it will take by looking at another similar project. It’s like an analogy, it’s similar to what we’re currently doing. Generally it’s less costly and less time-consuming than our other techniques, but also it is less accurate because we’re not really delving into the detail.
Last but not least there is 3-point estimating. This uses an average of three points – we might have the Optimistic estimate, the Pessimistic estimate, and the Most Likely estimate. The way that we end up working it out is: Let’s say our Optimistic schedule (O) is five days, our Most Likely (M) is seven days and then our Pessimistic (P) is ten days. We add each of them together and then we divide that by three, and that gives us the answer.
In fact here’s a better version that doesn’t take as much math or any decimals – let’s say we’ve got five, nine and ten divided by three – because 24 is a nice round number – we divide that by three and we get eight. And that’s how we do three-point estimating.
You might see a variation of this which is “Beta” or “PERT” (Program Evaluation Review Technique), where we’ve got Optimistic, then four times the most likely, and then our pessimistic as well, all divided by six instead.
And those are the project estimating techniques we will come across in the PMP Exam.
When we’re developing the project management plan a lot of the time we’re going to need to create baselines.
Baselines are one of the key concepts that is really important, because they are a point in time where data or information is locked in place, with any changes needing to go through a formal change or configuration management process to be reviewed, approved and accepted.
There are multiple documents that require baselining in your project management plan, and most of those will relate to the key constraints in your project such as:
Scope – the scope that you are going to deliver.
Time or the schedule – you might have your Gantt chart or the locked-in schedule, and you don’t really want that to change because you’re delivering something at the end and your customers are relying on that to be delivered.
Cost – if someone is sponsoring this project or paying for this project then of course they don’t want that cost to change, at least not without the proper approval process.
So what are these documents that we’re talking about? Well the need to be baselined fairly early on in your project, during the initiation and planning of your project.
First of all we’ve got the scope baseline. This is the approved version of a scope statement, a nice simple statement of what you are delivering to your customer. Then you’ve got the associated work breakdown structure or WBS and its associated WBS dictionary. That’s basically the scope broken down into smaller parts.
Then ultimately the activities that we’ll need to to deliver those parts – all of those parts of your scope – we want to lock that in so that we know that we’re going to deliver it on time, and we know if we’re not going to deliver it on time.
Then there is the schedule baseline, which is the approved version of the schedule model (that can be your Gantt or even just dates and activities depending on how you outline that in your project management plan) and can be used as a basis for comparison to the actual results so once it’s locked in. For example, how are we actually tracking over time? Are we on track, or we not going well? That’s what we really want to know.
Lastly we’ve got the cost baseline. This is the approved version of the time based project budget where we’ve got our activities, the things that need to be completed and we’ve got the cost associated with those activities. All of the schedule and the scope – if any of that changes then obviously that will have a big impact on the cost of the project as well, so all of these things are interrelated.
Before a baseline is actually defined, all of these documents can be updated as many times as necessary. You’ll find that right at the beginning of your project, during the project charter and maybe just before you’ve locked in your project management plan, no formal process is required at that time. But once that baseline is locked in then they can only be changed through the “perform integrated change control” process which we’ll probably notice is around 4.6 in the PMBOK guide. Any stakeholder can raise a change request, that’s how this is done. Anyone related to your project, whether it’s someone impacted by the project or whether it’s the sponsor who’s sponsoring the project, whether it’s the people doing the the work packages in the team of the project, they can raise a change request for that to be looked at which will go through the change control process. That change control process is usually outlined in your project management plan as the configuration management plan.
What Does a Configuration Management Plan Process look like?
It will be different for each organisation and even each team you work in. Maybe the process for you is raising a change request to the project manager, the project manager checks it out with a few different stakeholders or the required information, or maybe that’s someone in the project management team who then goes through to the sponsor or to the associated steering committee for example. Depending on how your project is outlined, which of course relates to the enterprise environmental factors which you’ll see come up a lot in the PMBOK guide. This is how the company operates, and every company is different. There will be similarities, there might be templates, there might be different politics or different parts of the company that need to be approached, or maybe different parts of the company that don’t talk to each other at all. You need to be aware of these enterprise environmental factors in how to get work done and that will impact the configuration management plan, which is how to make changes to your project and your project baselines once they are locked in. And that is project Baselines.
In a project manager role you will experience politics and power, and you’ll need to understand both of those things in order to get things done in an organization.
“Leadership” and “management” involve getting things done, but to do that a project manager needs to understand how an organization works. What is the culture? And what are the unwritten laws of getting things done? That will give you a higher chance of success, and that’s where you need to have a hefty serve of emotional intelligence to understand the politics and the power sources, and how to use those to your advantage. You’ll need to influence and guide and help deliver that business value as a project manager.
There’s a great list from the PMBOK guide on the types of power that you will come across.
You’ve got positional power, where you’re directly in the position of power as a manager or a leader.
Informational power, where you have information and you don’t need to share that with everyone – they need to come to you for that information.
Referent power, where you’re saying “The CEO asked me to do this, so everyone gather round and let’s get this done.” – we’re referring to someone else’s credibility.
Situational power, where maybe there’s a crisis involved and now all of a sudden we have more power because we need to really urgently get something done.
Personal power, using charm and attraction.
Relational power, where you are using your network of people
Expert power, where you have expertise in a certain area.
Rewards, where you can give rewards for certain things and that makes people want to do things for you.
Coercive power, where you might say “Something bad will happen if you don’t do this,” you’re coercing people into doing what you need.
Ingratiating power, where you’re using flattery – “Look how wonderful you’re doing, such a great job, you’re a wonderful person because you’re helping me out.”
All of these are valid, and you’ll find that when you’re aware of them you’ll see them more and more in your own workplace, and even in your day to day life. Within your family, within your friendship groups, it’s really great to be aware of.
And there are more.
You have pressure based power, limiting that freedom of choice.
Guilt based power, where maybe you did something for them and now you’re putting a bit of a guilt on them.
Persuasive power where you’re simply providing the right arguments, and lastly;
Avoiding power, where you’re simply refusing to participate.
These types of power will be on the PMP exam you’ll usually encounter them in some way shape or form simply because they’re part of everyday life and getting things done.
There are also different personalities that you’ll come across in your life as a project manager, and they are:
Authentic,
Courteous,
Creative,
Cultural where you’re measuring the sensitivity to other’s cultural values,
Emotional, being able to perceive other’s emotions quite easily,
Intellectual, which is just human intelligence and management practice
Political, understanding the political environment and how to make things happen,
Service-oriented where we’re serving others, maybe as a servant leader.
Social,
Systemic, where we’re understanding the need to build systems around things and ways of work and making it easier for people through processes as opposed to just forcing things through.
Those are the types of power and types of personalities you will find in your career and on the PMP Exam.


 Project Schedule Compression Techniques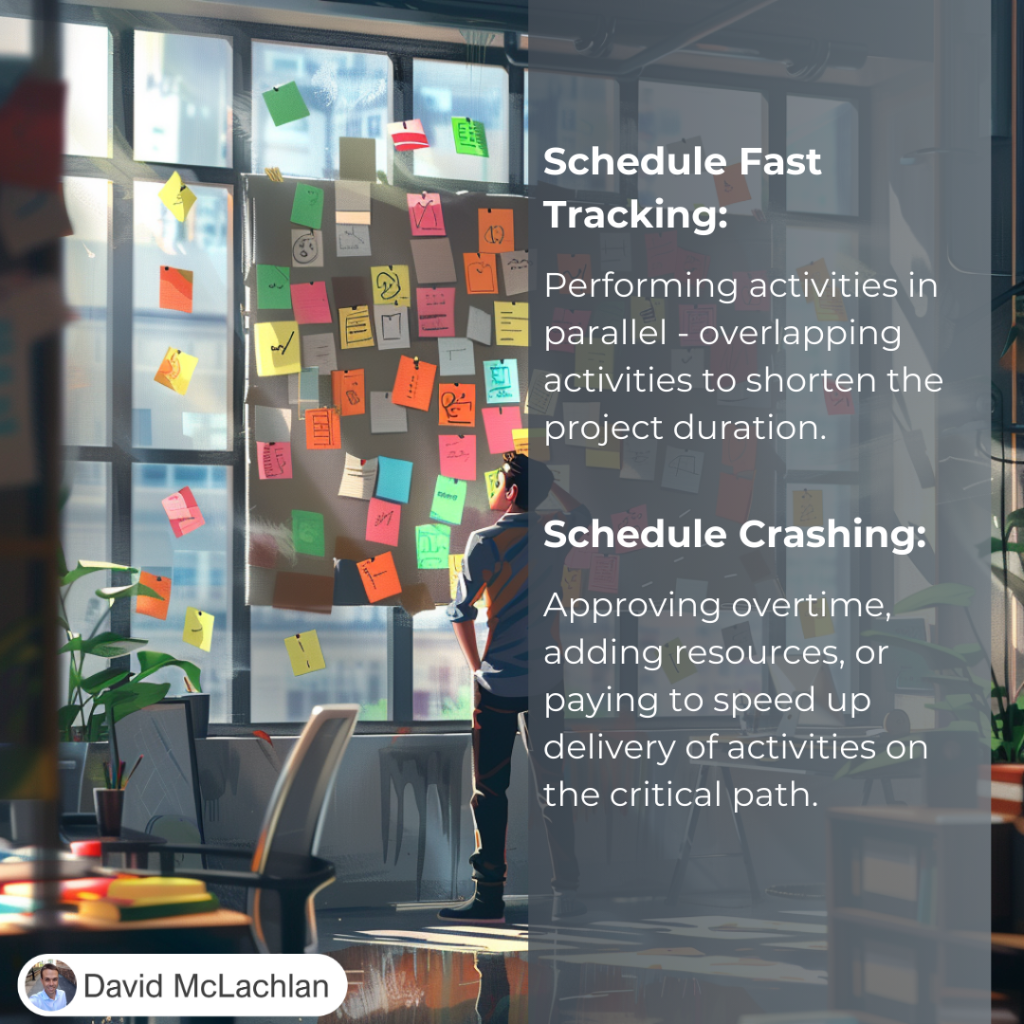
 Baselined Documents in Project Management